12) 12. A restaurant manager estimates that 45% of all customers would order the nightly special if it came with a free dessert. The manager selects a random sample of 50 customers to survey to see if they would order the nightly special if it came with a free dessert. a. Calculate the mean and standard deviation of the sampling distribution of p, the proportion of customers that answer yes to the survey. b. Justify that the sampling distribution of P is approximately normal. c. Calculate the probability that no more than 40% of the customers sampled answer yes to the survey.
12) 12. A restaurant manager estimates that 45% of all customers would order the nightly special if it came with a free dessert. The manager selects a random sample of 50 customers to survey to see if they would order the nightly special if it came with a free dessert. a. Calculate the mean and standard deviation of the sampling distribution of p, the proportion of customers that answer yes to the survey. b. Justify that the sampling distribution of P is approximately normal. c. Calculate the probability that no more than 40% of the customers sampled answer yes to the survey.

Glencoe Algebra 1, Student Edition, 9780079039897, 0079039898, 2018
18th Edition
ISBN:9780079039897
Author:Carter
Publisher:Carter
Chapter10: Statistics
Section10.6: Summarizing Categorical Data
Problem 28PPS

Related questions

Question
Transcribed Image Text:AChapter 6 Test
Chapter 6 Test
Your disk is almost full
choices?
Save space by optimizing storage.
Microsoft AutoUpdate
Update is ready to be installed.
12)
12. A restaurant manager estimates that 45% of all customers would order the nightly special if it came with a
free dessert. The manager selects a random sample of 50 customers to survey to see if they would order the
nightly special if it came with a free dessert.
a. Calculate the mean and standard deviation of the sampling distribution of P, the proportion of customers
that answer yes to the survey.
b. Justify that the sampling distribution of P is approximately normal.
c. Calculate the probability that no more than 40% of the customers sampled answer yes to the survey.
13)
The scores out of 50 points on a recent vocabulary test for all of the 120 students enrolled in a statistics class
at a local high school is approximately normally distributed with a mean of 34.82 points and a standard
deviation of 5.02 noints The teacher plans to select a random samnle of 6 students to survev ahout how to
Transcribed Image Text:docs.google.com
AChapter 6 Test
Chapter 6 Test
Your disk is almost full
Save space by optimizing storage.
Microsoft AutoUpdate
Up
Update is ready to be installed.
11)
Re
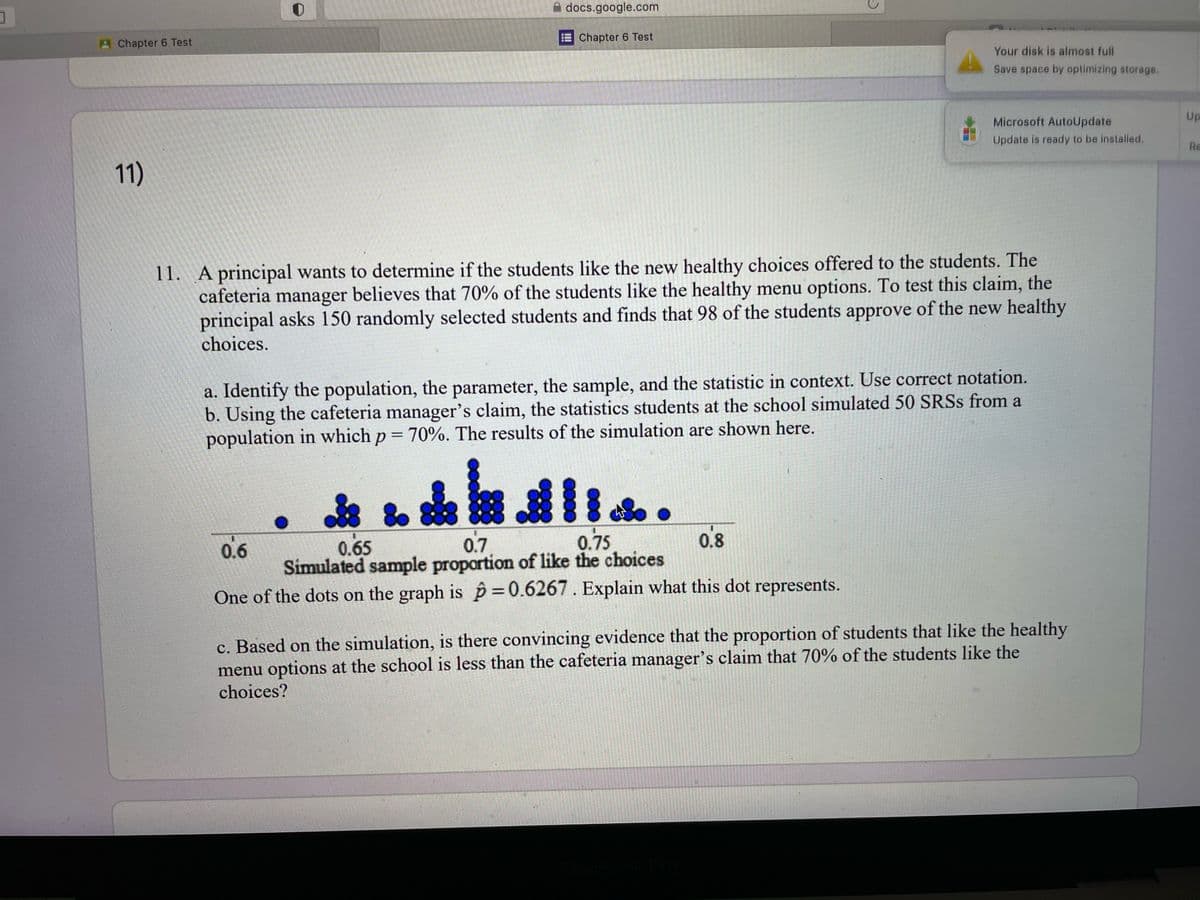
11. A principal wants to determine if the students like the new healthy choices offered to the students. The
cafeteria manager believes that 70% of the students like the healthy menu options. To test this claim, the
principal asks 150 randomly selected students and finds that 98 of the students approve of the new healthy
choices.
a. Identify the population, the parameter, the sample, and the statistic in context. Use correct notation.
b. Using the cafeteria manager's claim, the statistics students at the school simulated 50 SRSS from a
population in which p = 70%. The results of the simulation are shown here.
0.7
Simulated sample proportion of like the choices
One of the dots on the graph is p 0.6267. Explain what this dot represents.
0.6
0.65
0.75
0.8
c. Based on the simulation, is there convincing evidence that the proportion of students that like the healthy
menu options at the school is less than the cafeteria manager's claim that 70% of the students like the
choices?
Expert Solution
This question has been solved!
Explore an expertly crafted, step-by-step solution for a thorough understanding of key concepts.

This is a popular solution!

Trending now
This is a popular solution!

Step by step
Solved in 2 steps with 2 images

Knowledge Booster


Learn more about
Need a deep-dive on the concept behind this application? Look no further. Learn more about this topic, statistics and related others by exploring similar questions and additional content below.Recommended textbooks for you
Glencoe Algebra 1, Student Edition, 9780079039897…
Algebra
ISBN:
9780079039897
Author:
Carter
Publisher:
McGraw Hill
Glencoe Algebra 1, Student Edition, 9780079039897…
Algebra
ISBN:
9780079039897
Author:
Carter
Publisher:
McGraw Hill