12 2. You planted a sunflower seedling and kept track of its height h (in centimeters) over time t (in weeks). Use the data in the table to create a scatterplot on your graphing calculator. What type of function is modeled? 1 3 4 5 26 39 51 88 94 103 •112 B. Sketch the correlation coefficient scale. Make sure to include details such as strength and direction of relationship.
12 2. You planted a sunflower seedling and kept track of its height h (in centimeters) over time t (in weeks). Use the data in the table to create a scatterplot on your graphing calculator. What type of function is modeled? 1 3 4 5 26 39 51 88 94 103 •112 B. Sketch the correlation coefficient scale. Make sure to include details such as strength and direction of relationship.

Chapter5: Exponential And Logarithmic Functions
Section5.5: Exponential And Logarithmic Models
Problem 4ECP

Related questions
Question
Transcribed Image Text:12
2
1
2
3
4.
D.85
0.3
r =
r =
Stram pos
none
orrelation =
Correlation =
Correlation =
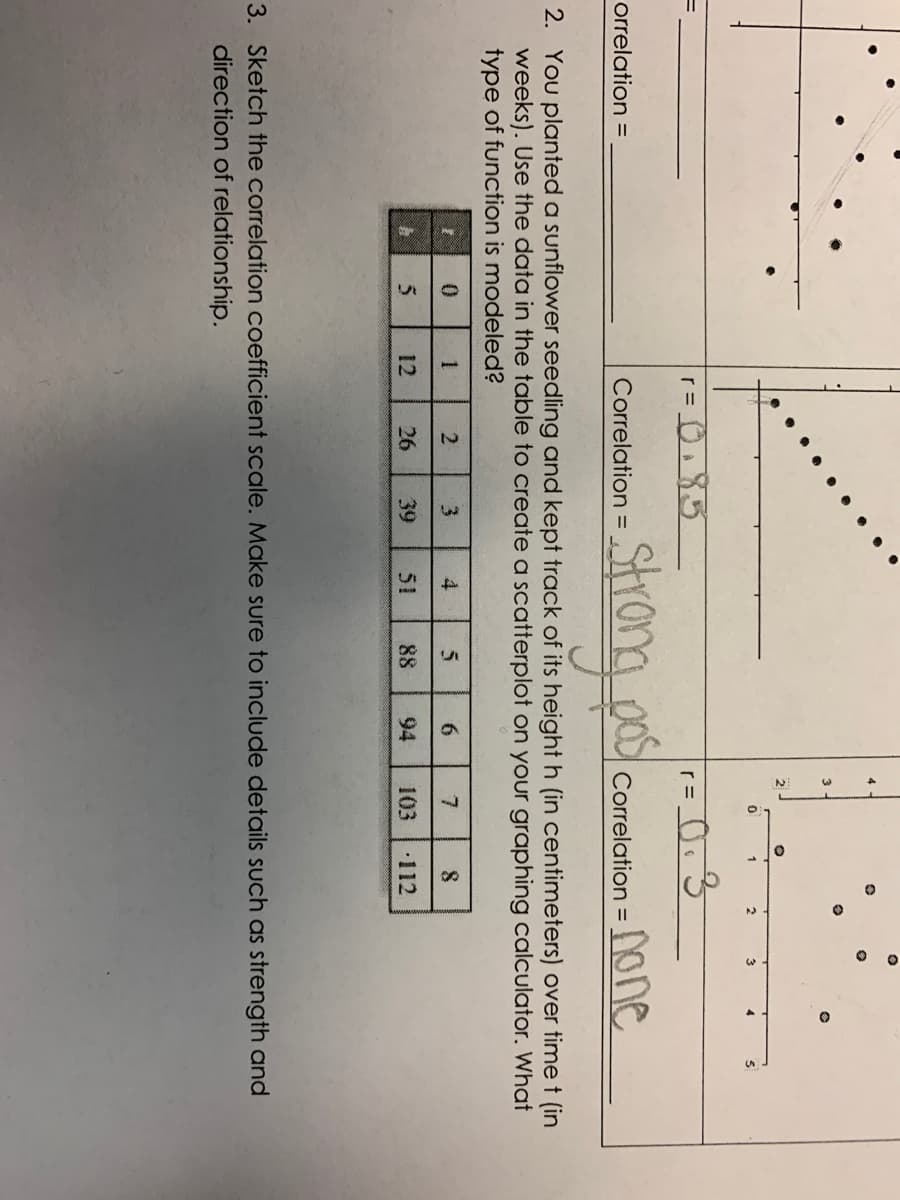
2. You planted a sunflower seedling and kept track of its height h (in centimeters) over time t (in
weeks). Use the data in the table to create a scatterplot on your graphing calculator. What
type of function is modeled?
1.
3
4
6
5
26
39
51
88
94
103
112
3. Sketch the correlation coefficient scale. Make sure to include details such as strength and
direction of relationship.
Expert Solution
This question has been solved!
Explore an expertly crafted, step-by-step solution for a thorough understanding of key concepts.

This is a popular solution!

Trending now
This is a popular solution!

Step by step
Solved in 3 steps with 2 images

Recommended textbooks for you

Trigonometry (MindTap Course List)
Trigonometry
ISBN:
9781337278461
Author:
Ron Larson
Publisher:
Cengage Learning

Algebra & Trigonometry with Analytic Geometry
Algebra
ISBN:
9781133382119
Author:
Swokowski
Publisher:
Cengage
Trigonometry (MindTap Course List)
Trigonometry
ISBN:
9781337278461
Author:
Ron Larson
Publisher:
Cengage Learning
Algebra & Trigonometry with Analytic Geometry
Algebra
ISBN:
9781133382119
Author:
Swokowski
Publisher:
Cengage


Functions and Change: A Modeling Approach to Coll…
Algebra
ISBN:
9781337111348
Author:
Bruce Crauder, Benny Evans, Alan Noell
Publisher:
Cengage Learning