12. An agronomy researcher was interested in determining the relationship between the number of wheat plants per unit area and grain production at a fixed fertility regimen. The experiment consisted of single factor (Planting Density at four levels: 20, 30, 40 and 50 plants per quarter-square meter plot) in a completely randomized design with three (3) replicate plots per planting density. The response for this experiment is yield in grams per plot. The data for this experiment appear in the following table: Planting Density 20 30 40 50 16.0 18.6 17.6 18.0 Grain 15.5 20.2 19.3 16.4 Yield (gm) 16.5 18.2 17.1 16.6
12. An agronomy researcher was interested in determining the relationship between the number of wheat plants per unit area and grain production at a fixed fertility regimen. The experiment consisted of single factor (Planting Density at four levels: 20, 30, 40 and 50 plants per quarter-square meter plot) in a completely randomized design with three (3) replicate plots per planting density. The response for this experiment is yield in grams per plot. The data for this experiment appear in the following table: Planting Density 20 30 40 50 16.0 18.6 17.6 18.0 Grain 15.5 20.2 19.3 16.4 Yield (gm) 16.5 18.2 17.1 16.6

Glencoe Algebra 1, Student Edition, 9780079039897, 0079039898, 2018
18th Edition
ISBN:9780079039897
Author:Carter
Publisher:Carter
Chapter10: Statistics
Section10.6: Summarizing Categorical Data
Problem 10CYU

Related questions
Question
Find the sum of squares, degrees of freedom, mean squares, F, Pvalue
Source: Planting Density, Error, Total
Transcribed Image Text:Problem Solving
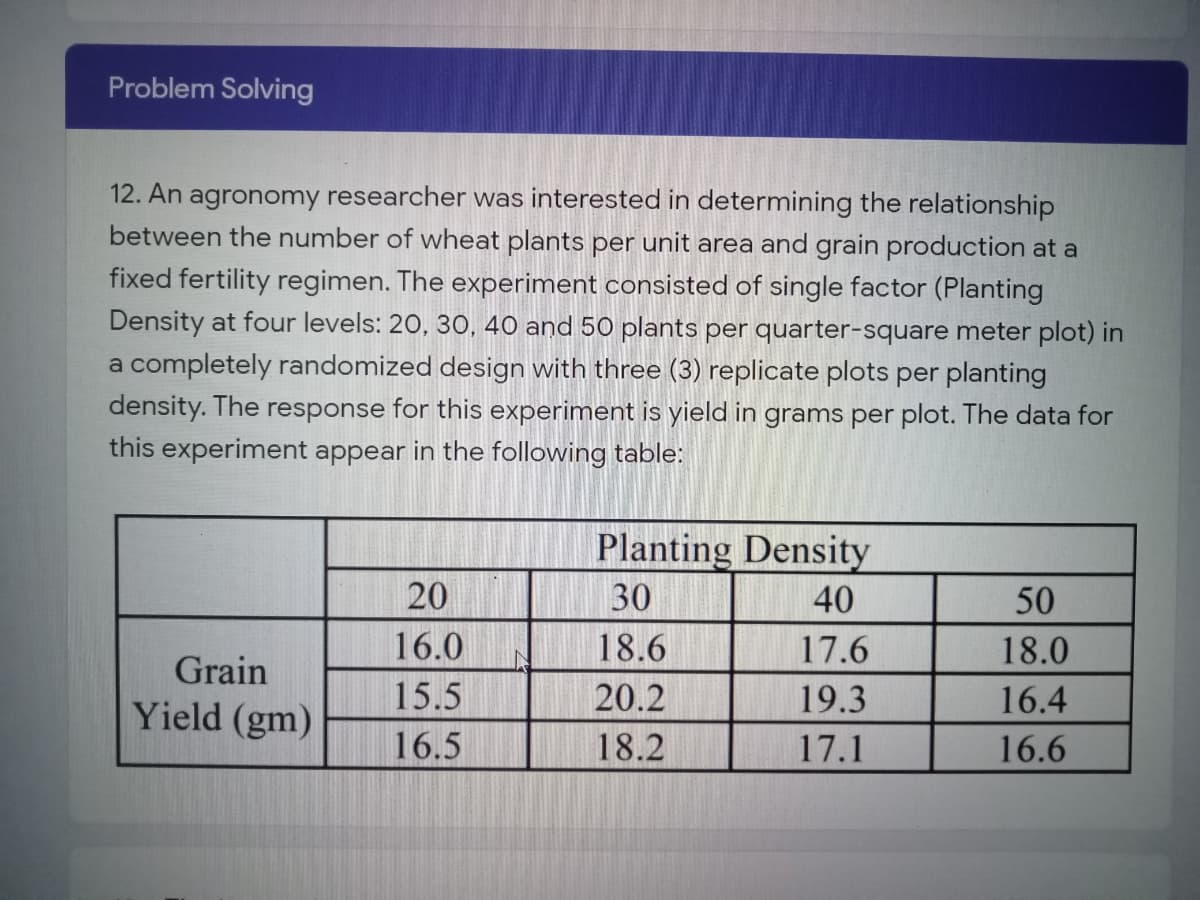
12. An agronomy researcher was interested in determining the relationship
between the number of wheat plants per unit area and grain production at a
fixed fertility regimen. The experiment consisted of single factor (Planting
Density at four levels: 20, 30, 40 and 50 plants per quarter-square meter plot) in
a completely randomized design with three (3) replicate plots per planting
density. The response for this experiment is yield in grams per plot. The data for
this experiment appear in the following table:
Planting Density
20
30
40
50
16.0
18.6
17.6
18.0
Grain
15.5
20.2
19.3
16.4
Yield (gm)
16.5
18.2
17.1
16.6
Expert Solution
This question has been solved!
Explore an expertly crafted, step-by-step solution for a thorough understanding of key concepts.

Step by step
Solved in 3 steps

Recommended textbooks for you
Glencoe Algebra 1, Student Edition, 9780079039897…
Algebra
ISBN:
9780079039897
Author:
Carter
Publisher:
McGraw Hill

Holt Mcdougal Larson Pre-algebra: Student Edition…
Algebra
ISBN:
9780547587776
Author:
HOLT MCDOUGAL
Publisher:
HOLT MCDOUGAL
Glencoe Algebra 1, Student Edition, 9780079039897…
Algebra
ISBN:
9780079039897
Author:
Carter
Publisher:
McGraw Hill
Holt Mcdougal Larson Pre-algebra: Student Edition…
Algebra
ISBN:
9780547587776
Author:
HOLT MCDOUGAL
Publisher:
HOLT MCDOUGAL