12. From the most recent national census, it is found that the number of children (X) in American families follows the following probability distribution: Number of Proportion of children, X families. P(x) 0 . 0.48 1. . 0.20 2. . 0.15 3.. ..... .... 0.08 4. .... 0.05 5. ****.... 0.03 .... 0.01 It is assumed that the proportion of families with more than six children is negligible. a. Find the expected value and standard deviation of X. b. Form a stick diagram of this distribution. Is the distribution skewed? c. find var(X).
12. From the most recent national census, it is found that the number of children (X) in American families follows the following probability distribution: Number of Proportion of children, X families. P(x) 0 . 0.48 1. . 0.20 2. . 0.15 3.. ..... .... 0.08 4. .... 0.05 5. ****.... 0.03 .... 0.01 It is assumed that the proportion of families with more than six children is negligible. a. Find the expected value and standard deviation of X. b. Form a stick diagram of this distribution. Is the distribution skewed? c. find var(X).

Holt Mcdougal Larson Pre-algebra: Student Edition 2012
1st Edition
ISBN:9780547587776
Author:HOLT MCDOUGAL
Publisher:HOLT MCDOUGAL
Chapter11: Data Analysis And Probability
Section11.8: Probabilities Of Disjoint And Overlapping Events
Problem 2C

Related questions
Question
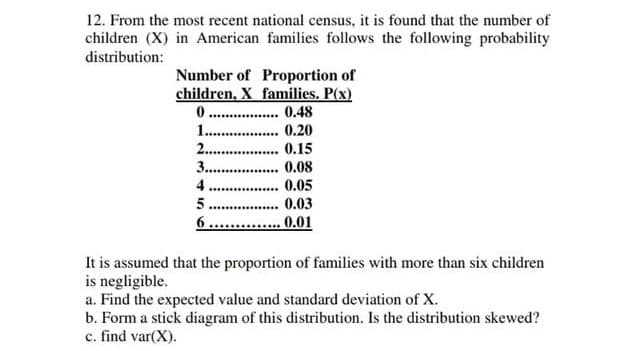
Transcribed Image Text:12. From the most recent national census, it is found that the number of
children (X) in American families follows the following probability
distribution:
Number of Proportion of
children, X families. P(x)
0..
****........ 0.48
1. . 0.20
2..
0.15
3..
4.
5.
6.
0.08
0.05
............
0.03
.*.........
0.01
.........
It is assumed that the proportion of families with more than six children
is negligible.
a. Find the expected value and standard deviation of X.
b. Form a stick diagram of this distribution. Is the distribution skewed?
c. find var(X).
Expert Solution
This question has been solved!
Explore an expertly crafted, step-by-step solution for a thorough understanding of key concepts.

Step by step
Solved in 3 steps with 1 images

Recommended textbooks for you
Holt Mcdougal Larson Pre-algebra: Student Edition…
Algebra
ISBN:
9780547587776
Author:
HOLT MCDOUGAL
Publisher:
HOLT MCDOUGAL

Holt Mcdougal Larson Pre-algebra: Student Edition…
Algebra
ISBN:
9780547587776
Author:
HOLT MCDOUGAL
Publisher:
HOLT MCDOUGAL