12. (MINITAB doesn't support this method. See Chapter 8 in the DOE book.) An experiment is required to estimate the slope of response y as a linear function of independent variable x, i.e. the model for y(x) has the form yi bo+bixi + Ei where the b; are regression coefficients that estimate the B; parameters. The safe range of x values is limited to the interval 20≤ x ≤ 40. The nominal slope is expected to be ẞ₁ = dy/dx = 6 and the experiment must estimate the true slope with 10% precision and 95% confidence, i.e. the 95% confidence interval for the slope parameter ẞ₁ should have the form P(b₁-8< ß₁
12. (MINITAB doesn't support this method. See Chapter 8 in the DOE book.) An experiment is required to estimate the slope of response y as a linear function of independent variable x, i.e. the model for y(x) has the form yi bo+bixi + Ei where the b; are regression coefficients that estimate the B; parameters. The safe range of x values is limited to the interval 20≤ x ≤ 40. The nominal slope is expected to be ẞ₁ = dy/dx = 6 and the experiment must estimate the true slope with 10% precision and 95% confidence, i.e. the 95% confidence interval for the slope parameter ẞ₁ should have the form P(b₁-8< ß₁

College Algebra
7th Edition
ISBN:9781305115545
Author:James Stewart, Lothar Redlin, Saleem Watson
Publisher:James Stewart, Lothar Redlin, Saleem Watson
Chapter1: Equations And Graphs
Section: Chapter Questions
Problem 10T: Olympic Pole Vault The graph in Figure 7 indicates that in recent years the winning Olympic men’s...

Related questions
Question
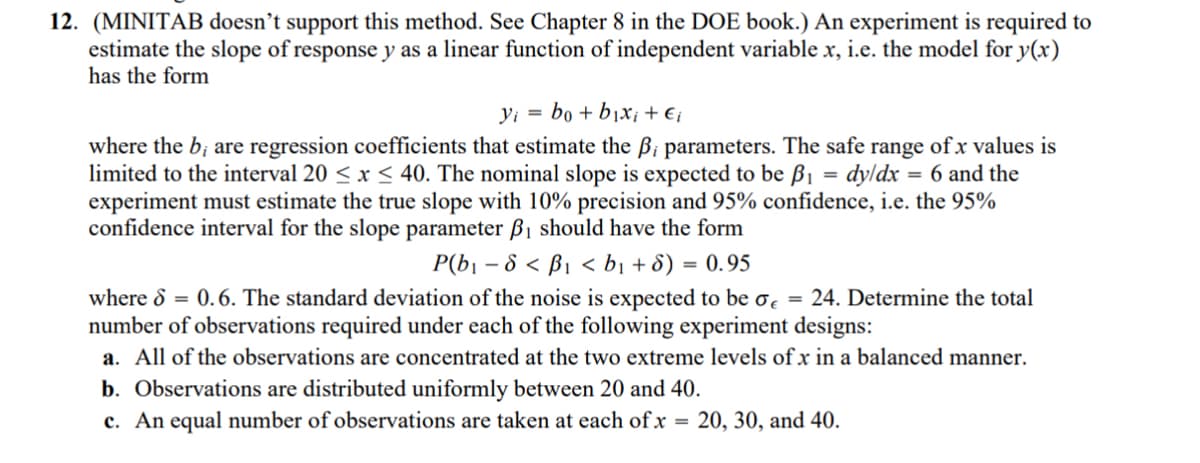
Transcribed Image Text:12. (MINITAB doesn't support this method. See Chapter 8 in the DOE book.) An experiment is required to
estimate the slope of response y as a linear function of independent variable x, i.e. the model for y(x)
has the form
yi bo+bixi + Ei
where the b; are regression coefficients that estimate the B; parameters. The safe range of x values is
limited to the interval 20≤ x ≤ 40. The nominal slope is expected to be ẞ₁ = dy/dx = 6 and the
experiment must estimate the true slope with 10% precision and 95% confidence, i.e. the 95%
confidence interval for the slope parameter ẞ₁ should have the form
P(b₁-8< ß₁ <b₁ + 8) = 0.95
where 6 = 0.6. The standard deviation of the noise is expected to be σ = 24. Determine the total
number of observations required under each of the following experiment designs:
a. All of the observations are concentrated at the two extreme levels of x in a balanced manner.
b. Observations are distributed uniformly between 20 and 40.
c. An equal number of observations are taken at each of x = 20, 30, and 40.
Expert Solution
This question has been solved!
Explore an expertly crafted, step-by-step solution for a thorough understanding of key concepts.

This is a popular solution!

Trending now
This is a popular solution!

Step by step
Solved in 2 steps

Recommended textbooks for you
College Algebra
Algebra
ISBN:
9781305115545
Author:
James Stewart, Lothar Redlin, Saleem Watson
Publisher:
Cengage Learning

Algebra & Trigonometry with Analytic Geometry
Algebra
ISBN:
9781133382119
Author:
Swokowski
Publisher:
Cengage

Algebra and Trigonometry (MindTap Course List)
Algebra
ISBN:
9781305071742
Author:
James Stewart, Lothar Redlin, Saleem Watson
Publisher:
Cengage Learning
College Algebra
Algebra
ISBN:
9781305115545
Author:
James Stewart, Lothar Redlin, Saleem Watson
Publisher:
Cengage Learning
Algebra & Trigonometry with Analytic Geometry
Algebra
ISBN:
9781133382119
Author:
Swokowski
Publisher:
Cengage
Algebra and Trigonometry (MindTap Course List)
Algebra
ISBN:
9781305071742
Author:
James Stewart, Lothar Redlin, Saleem Watson
Publisher:
Cengage Learning