12. Suppose a math class had a set of marks with a mean of 67% and a standard deviation of 10%. The teacher "bell-curved" the results and added 8% to each students mark. Describe the effect (if any) of this bell-curve on each of the following: a) mean b) the graph of the box-and whisker plot
12. Suppose a math class had a set of marks with a mean of 67% and a standard deviation of 10%. The teacher "bell-curved" the results and added 8% to each students mark. Describe the effect (if any) of this bell-curve on each of the following: a) mean b) the graph of the box-and whisker plot

Glencoe Algebra 1, Student Edition, 9780079039897, 0079039898, 2018
18th Edition
ISBN:9780079039897
Author:Carter
Publisher:Carter
Chapter10: Statistics
Section10.5: Comparing Sets Of Data
Problem 13PPS

Related questions
Question
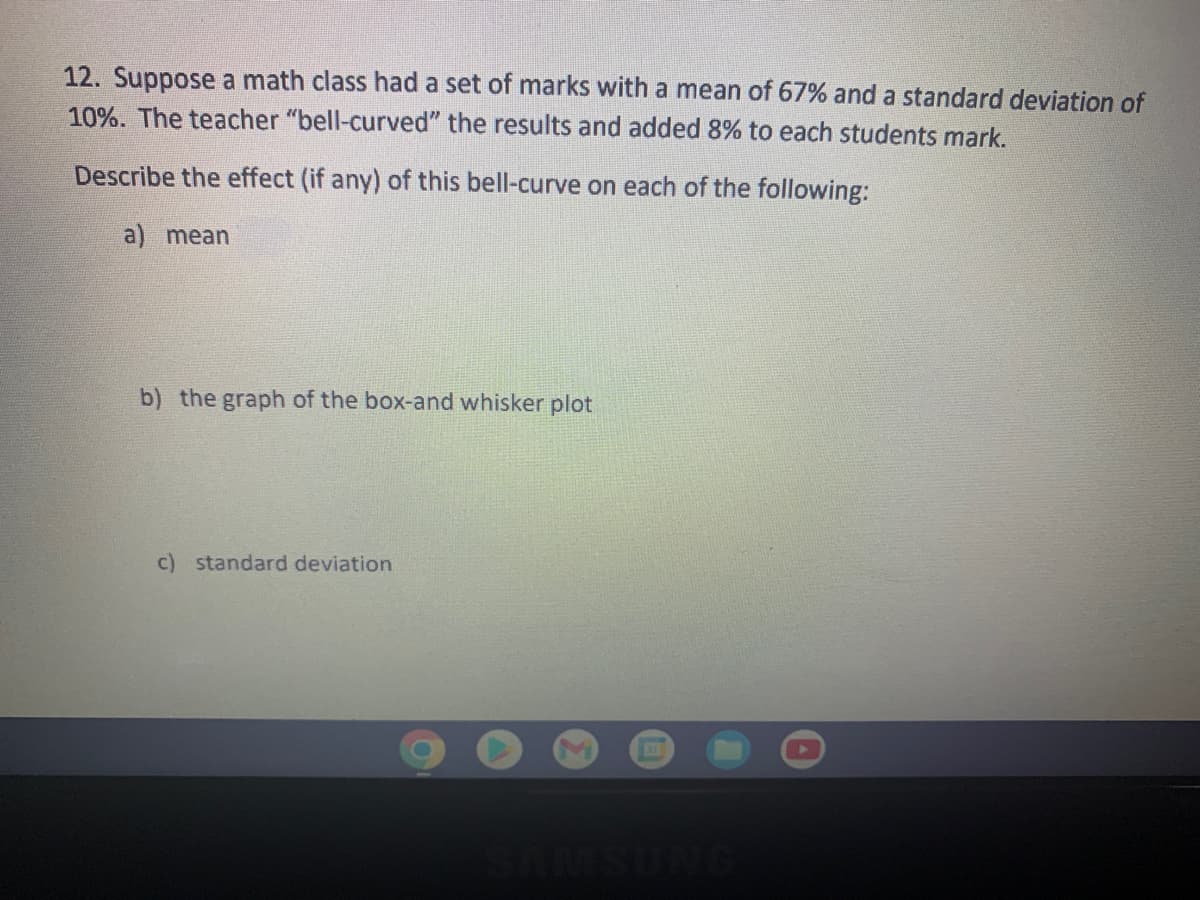
Transcribed Image Text:12. Suppose a math class had a set of marks with a mean of 67% and a standard deviation of
10%. The teacher "bell-curved" the results and added 8% to each students mark.
Describe the effect (if any) of this bell-curve on each of the following:
a) mean
b) the graph of the box-and whisker plot
c) standard deviation
Expert Solution
This question has been solved!
Explore an expertly crafted, step-by-step solution for a thorough understanding of key concepts.

Step by step
Solved in 3 steps

Recommended textbooks for you
Glencoe Algebra 1, Student Edition, 9780079039897…
Algebra
ISBN:
9780079039897
Author:
Carter
Publisher:
McGraw Hill
Glencoe Algebra 1, Student Edition, 9780079039897…
Algebra
ISBN:
9780079039897
Author:
Carter
Publisher:
McGraw Hill