13. Listed below are the lead concentrations in µg/g measured in different traditional medicines. Use a 0.05 significance level to test the claim that the mean lead concentration for all such medicines is less than 16 µg/g. Assume that the sample is a simple random sample. 16 14.5 21.5 22.5 11 3.5 3 22 22.5 3 a. Identify the null and alternative hypotheses. b. Identify the test statistic for this hypothesis test. c. Identify the P-value for this hypothesis test. d. State the final conclusion that addresses the original claim.
13. Listed below are the lead concentrations in µg/g measured in different traditional medicines. Use a 0.05 significance level to test the claim that the mean lead concentration for all such medicines is less than 16 µg/g. Assume that the sample is a simple random sample. 16 14.5 21.5 22.5 11 3.5 3 22 22.5 3 a. Identify the null and alternative hypotheses. b. Identify the test statistic for this hypothesis test. c. Identify the P-value for this hypothesis test. d. State the final conclusion that addresses the original claim.

Holt Mcdougal Larson Pre-algebra: Student Edition 2012
1st Edition
ISBN:9780547587776
Author:HOLT MCDOUGAL
Publisher:HOLT MCDOUGAL
Chapter11: Data Analysis And Probability
Section: Chapter Questions
Problem 8CR

Related questions
Question
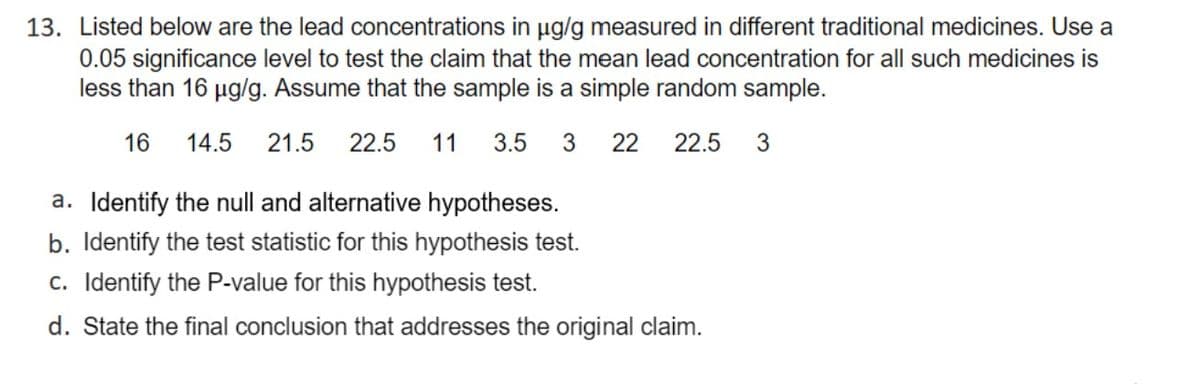
Transcribed Image Text:13. Listed below are the lead concentrations in µg/g measured in different traditional medicines. Use a
0.05 significance level to test the claim that the mean lead concentration for all such medicines is
less than 16 µg/g. Assume that the sample is a simple random sample.
16 14.5 21.5 22.5 11 3.5 3 22 22.5 3
a. Identify the null and alternative hypotheses.
b. Identify the test statistic for this hypothesis test.
c. Identify the P-value for this hypothesis test.
d. State the final conclusion that addresses the original claim.
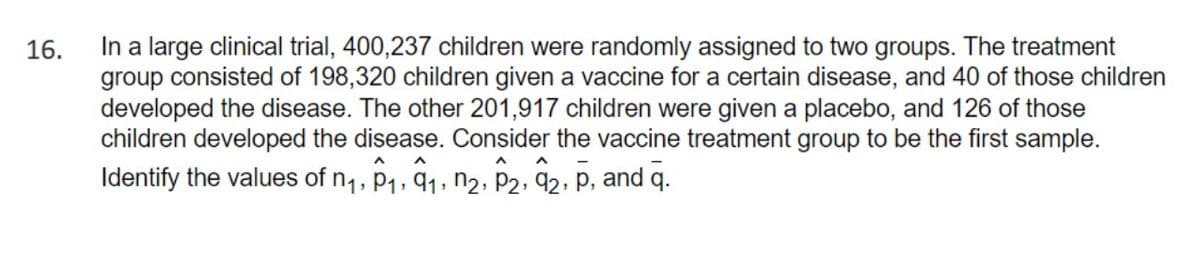
Transcribed Image Text:16.
In a large clinical trial, 400,237 children were randomly assigned to two groups. The treatment
group consisted of 198,320 children given a vaccine for a certain disease, and 40 of those children
developed the disease. The other 201,917 children were given a placebo, and 126 of those
children developed the disease. Consider the vaccine treatment group to be the first sample.
A
Identify the values of n₁, P₁, 9₁, n₂, P₂, 92, P, and q.
1,
Expert Solution
This question has been solved!
Explore an expertly crafted, step-by-step solution for a thorough understanding of key concepts.

This is a popular solution!

Trending now
This is a popular solution!

Step by step
Solved in 6 steps

Recommended textbooks for you
Holt Mcdougal Larson Pre-algebra: Student Edition…
Algebra
ISBN:
9780547587776
Author:
HOLT MCDOUGAL
Publisher:
HOLT MCDOUGAL

College Algebra (MindTap Course List)
Algebra
ISBN:
9781305652231
Author:
R. David Gustafson, Jeff Hughes
Publisher:
Cengage Learning
Holt Mcdougal Larson Pre-algebra: Student Edition…
Algebra
ISBN:
9780547587776
Author:
HOLT MCDOUGAL
Publisher:
HOLT MCDOUGAL
College Algebra (MindTap Course List)
Algebra
ISBN:
9781305652231
Author:
R. David Gustafson, Jeff Hughes
Publisher:
Cengage Learning