13. Skech the hird bell curve by showing the mean and standard deviation. 14. What are the data values (raw scores) associated with sandard scores of -1.05 and 0.05? Determine the percentage in between these scores. Draw the curve and show your complete solation. 15. What are the data values (raw scares) associated with standard scores of -0.09 and 1.15? Determine the percentage in between these scores. Draw the curve and show your complete solution.
13. Skech the hird bell curve by showing the mean and standard deviation. 14. What are the data values (raw scores) associated with sandard scores of -1.05 and 0.05? Determine the percentage in between these scores. Draw the curve and show your complete solation. 15. What are the data values (raw scares) associated with standard scores of -0.09 and 1.15? Determine the percentage in between these scores. Draw the curve and show your complete solution.

Algebra & Trigonometry with Analytic Geometry
13th Edition
ISBN:9781133382119
Author:Swokowski
Publisher:Swokowski
Chapter4: Polynomial And Rational Functions
Section4.6: Variation
Problem 37E

Related questions
Question
13 14 15 typewritten
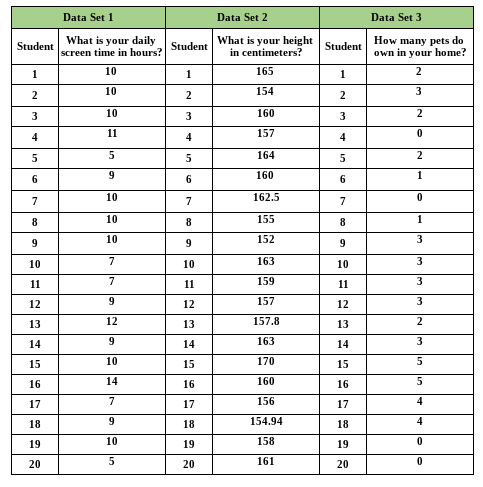
Transcribed Image Text:Data Set 1
Data Set 2
Data Set 3
What is your daily
screen time in hours?
What is your height
in centimeters?
How many pets do
own in your home?
Student
Student
Student
1
10
1
165
1
2
10
154
3
2
2
10
160
3
11
157
4
4
4
5
164
160
1
6.
6
6.
10
162.5
7
7
7
10
8
155
8
1
10
152
3
10
10
163
10
11
7
11
159
11
3
12
12
157
12
13
12
13
157.8
13
14
14
163
14
15
10
15
170
15
16
14
16
160
16
17
7
17
156
17
4
18
18
154.94
18
4
19
10
19
158
19
20
20
161
20
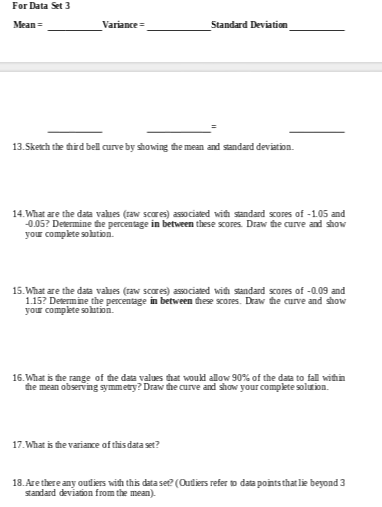
Transcribed Image Text:For Data Set 3
Mean =
Variance =
Standard Deviation
13.Sketh the third bell curve by showing the mean and sandard deviation.
14. What are the data values (raw scores) associated with sandard scores of -1.05 and
-0.05? Determine the percentage in between these scores. Draw the curve ad show
your complete solution.
15.What are the data values (raw scares) associated with standard scores of -0.09 and
1.15? Determine the percentage in between these scores. Draw the curve and show
your complete sohtion.
16. What is the range of the data values that woukd allow 90% of the data to fall within
the mean observing symmetry? Draw the curve and show your complete solution.
17. What is the variance of this data set?
18.Are there any outiers with this data set? (Outliers refer o data points that lie beyond 3
standard deviation from the mean).
Expert Solution
This question has been solved!
Explore an expertly crafted, step-by-step solution for a thorough understanding of key concepts.

Step by step
Solved in 4 steps with 4 images

Recommended textbooks for you
Algebra & Trigonometry with Analytic Geometry
Algebra
ISBN:
9781133382119
Author:
Swokowski
Publisher:
Cengage

Glencoe Algebra 1, Student Edition, 9780079039897…
Algebra
ISBN:
9780079039897
Author:
Carter
Publisher:
McGraw Hill

Algebra and Trigonometry (MindTap Course List)
Algebra
ISBN:
9781305071742
Author:
James Stewart, Lothar Redlin, Saleem Watson
Publisher:
Cengage Learning
Algebra & Trigonometry with Analytic Geometry
Algebra
ISBN:
9781133382119
Author:
Swokowski
Publisher:
Cengage
Glencoe Algebra 1, Student Edition, 9780079039897…
Algebra
ISBN:
9780079039897
Author:
Carter
Publisher:
McGraw Hill
Algebra and Trigonometry (MindTap Course List)
Algebra
ISBN:
9781305071742
Author:
James Stewart, Lothar Redlin, Saleem Watson
Publisher:
Cengage Learning

Big Ideas Math A Bridge To Success Algebra 1: Stu…
Algebra
ISBN:
9781680331141
Author:
HOUGHTON MIFFLIN HARCOURT
Publisher:
Houghton Mifflin Harcourt

Functions and Change: A Modeling Approach to Coll…
Algebra
ISBN:
9781337111348
Author:
Bruce Crauder, Benny Evans, Alan Noell
Publisher:
Cengage Learning

College Algebra
Algebra
ISBN:
9781305115545
Author:
James Stewart, Lothar Redlin, Saleem Watson
Publisher:
Cengage Learning