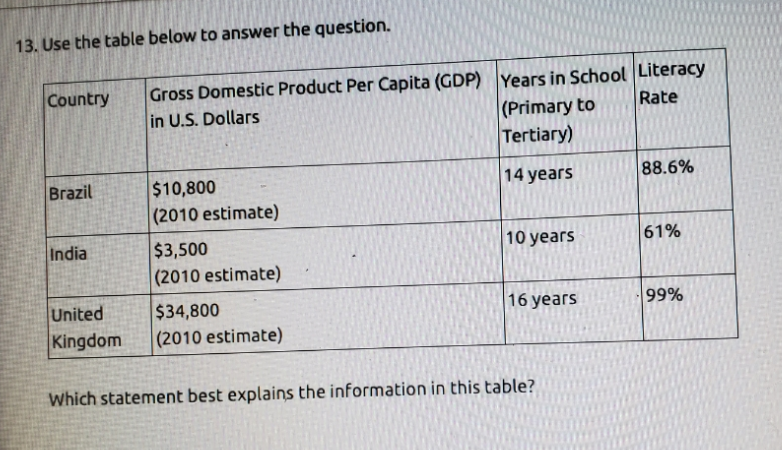
13. Use the table below to answer the question. Gross Domestic Product Per Capita (GDP) Years in SchoolLiteracy in U.S. Dollars Country Rate (Primary to Tertiary) Brazil 14 years 88.6% $10,800 (2010 estimate) India 10 years 61% $3,500 (2010 estimate) United 16 years 99% $34,800 (2010 estimate) Kingdom Which statement best explains the information in this table?
13. Use the table below to answer the question. Gross Domestic Product Per Capita (GDP) Years in SchoolLiteracy in U.S. Dollars Country Rate (Primary to Tertiary) Brazil 14 years 88.6% $10,800 (2010 estimate) India 10 years 61% $3,500 (2010 estimate) United 16 years 99% $34,800 (2010 estimate) Kingdom Which statement best explains the information in this table?

Essentials of Economics (MindTap Course List)
8th Edition
ISBN:9781337091992
Author:N. Gregory Mankiw
Publisher:N. Gregory Mankiw
Chapter17: Production And Growth
Section: Chapter Questions
Problem 7PA

Related questions
Question
Transcribed Image Text:13. Use the table below to answer the question.
Gross Domestic Product Per Capita (GDP) Years in SchoolLiteracy
in U.S. Dollars
Country
Rate
(Primary to
Tertiary)
Brazil
14 years
88.6%
$10,800
(2010 estimate)
India
10 years
61%
$3,500
(2010 estimate)
United
16 years
99%
$34,800
(2010 estimate)
Kingdom
Which statement best explains the information in this table?
Expert Solution
This question has been solved!
Explore an expertly crafted, step-by-step solution for a thorough understanding of key concepts.

This is a popular solution!

Trending now
This is a popular solution!

Step by step
Solved in 3 steps

Recommended textbooks for you
Essentials of Economics (MindTap Course List)
Economics
ISBN:
9781337091992
Author:
N. Gregory Mankiw
Publisher:
Cengage Learning

Brief Principles of Macroeconomics (MindTap Cours…
Economics
ISBN:
9781337091985
Author:
N. Gregory Mankiw
Publisher:
Cengage Learning

Principles of Economics 2e
Economics
ISBN:
9781947172364
Author:
Steven A. Greenlaw; David Shapiro
Publisher:
OpenStax
Essentials of Economics (MindTap Course List)
Economics
ISBN:
9781337091992
Author:
N. Gregory Mankiw
Publisher:
Cengage Learning
Brief Principles of Macroeconomics (MindTap Cours…
Economics
ISBN:
9781337091985
Author:
N. Gregory Mankiw
Publisher:
Cengage Learning
Principles of Economics 2e
Economics
ISBN:
9781947172364
Author:
Steven A. Greenlaw; David Shapiro
Publisher:
OpenStax