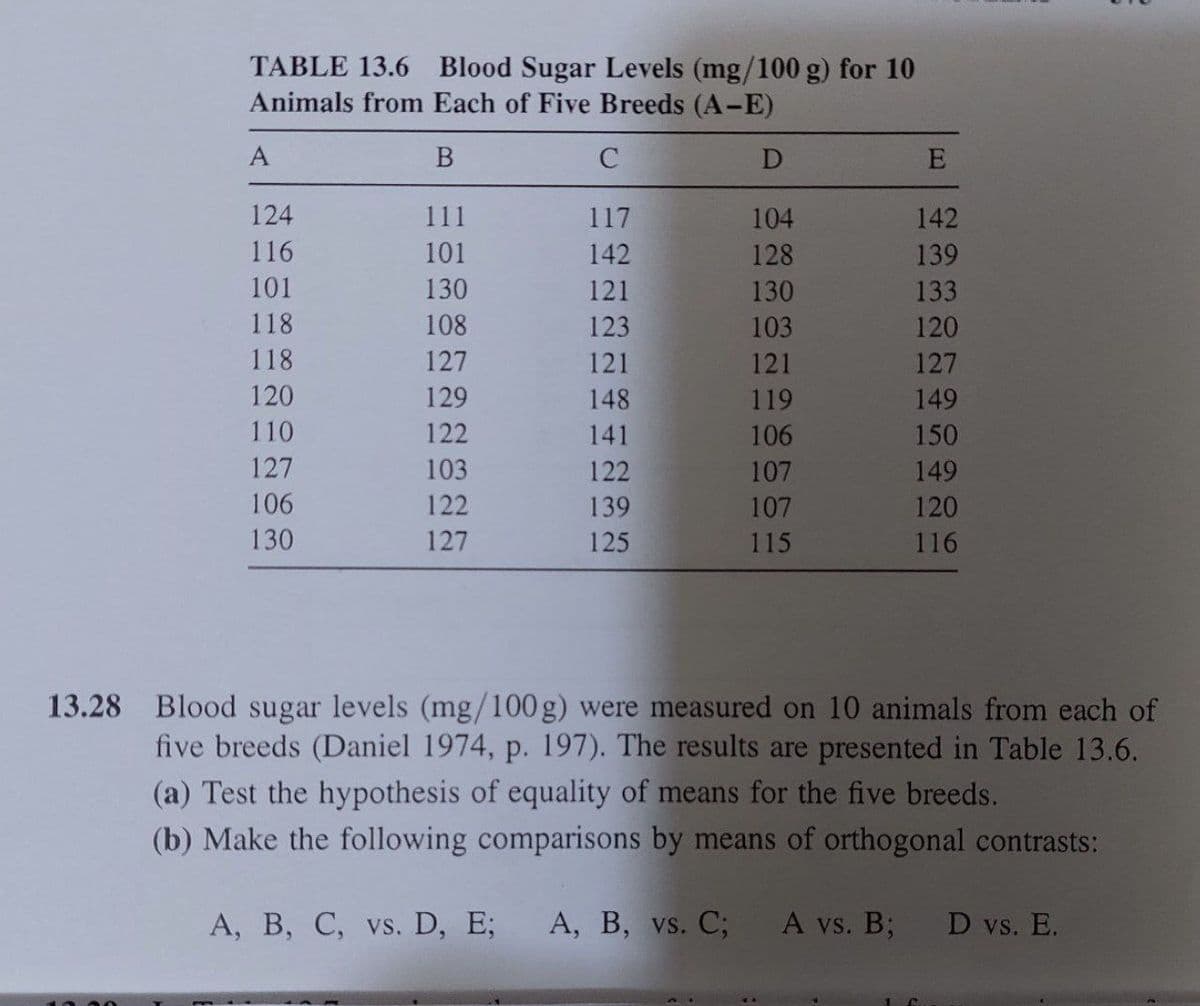
13.28 Blood sugar levels (mg/100 g) were measured on 10 animals from each of five breeds (Daniel 1974, p. 197). The results are presented in Table 13.6. (a) Test the hypothesis of equality of means for the five breeds. (b) Make the following comparisons by means of orthogonal contrasts: A, B, C, vs. D, E; A, B, vs. C; A vs. B; D vs. E.


Q: A large store has a customer service department where customers can go to ask for help with…
A: Given that n=4, p=1/4, q=1-p=1-(1/4)=3/4 X~Binomial(n=4,p=1/4) X be the number of customers who go…
Q: there is no solution
A: Note: According to Bartleby guidelines, we can solve maximum of three subparts in a question and…
Q: The number of sales calls by a sample of 25 pharmaceutical salespersons are provided in the table…
A: The number of sales calls by a sample of 25 pharmaceutical salespersons is provided below, 40 56…
Q: a. Find the probability that at least one household is tuned to 60 Minutes. b. Find the probability…
A: Let X be the random variable that the number of households is tuned to 60 minutes. Here X ~ bin(n =…
Q: A study analyzed data from the National Longitudinal Study of Adolescent Health. Participants were…
A: We know that percentage in this case will be % of row value= row value*100/ Grand total
Q: In a recent Gallup poll, pollsters randomly selected adults and asked them whether they smoke. Among…
A: The question is about inferential stats Introduction : Statistic : It is a numerical value which…
Q: Question 15 The most important quality of a test or assessment instrument is objectivity. True O…
A: “Since you have posted multiple questions, we will provide the solutiononly to the first question as…
Q: Given the following information: My confidence intervals: 90% confidence interval = (2.33, 2.56),…
A: 1. The obtained confidence intervals are: 90% confidence interval = (2.33, 2.56), and 99% confidence…
Q: Given a 99% confidence interval for a population as mean (3.59, 6.75) calculate the margin of error…
A: From the provided information, Confidence level = 99% Confidence interval is (3.59, 6.75).
Q: 3 5 6 7 8 9 10 11 12 13 14 15 16 17 18 19 20 21 21 21 24 25 26 27 21 29 do 01 32 Sex Male Female…
A: Introduction A variable is a characteristic which can be measured.
Q: 9. Temperature Frequency Relative Frequency 70 - 74 3 3/61= 0.0492 75 - 79 16 16/61= 0.2623 80 - 84…
A: The question is about frequency distribution Given : To find : Value of mean
Q: A student created two different prediction models with the data from Practice question A, with two…
A: Given variable on x_axis ranking_Aotearoa_new_zealand variable on y-axis ranking_australia…
Q: If your inflation forecast for the current month is 0.072 (7.2 percent) and the actual inflation is…
A:
Q: You are testing the claim that the mean GPA of night students is different from the mean GPA of day…
A:
Q: You're the head chair of a popular clan of 30 video-game streamers, who go viral on various video…
A: Given Information: Sample Meanx¯=0.18Sample standard deviation s=0.04Sample size (n)=30Population…
Q: What percentage of infants who test positive using the test will actually have Down’s syndrome?
A: Let us define some events A : an infant has Down's syndrome. B : an infant does not have Down's…
Q: 2. The example on page 5 of chapter 6 notes asks for the probability for a single and (part a) and…
A: It is given that Mean, μ = 69 Standard deviation, σ = 3 Sample size, n = 7
Q: Express the confidence interval 18.7% < p < 34.9% in the form of p± ME. 26.8 ✓0% ± %
A: The confidence interval is given by 18.7% < p < 34.9%
Q: 2. Below is a listing of all U.S. Presidents and the number of children they had, sorted by the…
A: Five number summary is: Min, First quartile, Median, Third quartile, Max Here sample size is n=…
Q: Find the five-number summary for Drug A. Round to 4 decimal places. Minimum: Q1: Minimum: Q3: Find…
A:
Q: The average final exam score for the statistics course is 81%. A professor wants to see if the…
A: Note- Since you have posted a question with multiple sub-parts, we will solve the first three…
Q: A vending machine dispenses coffee into a sixteen-ounce cup. The amount of coffee dispensed into the…
A: Given The data is as follows: X=16 σ=0.08 2% of the time, the cup is allowed to be overfilled
Q: Unstandardized Residual 100 -100 500 1000 1500 Income 2000 2500 3000
A: A residual plot essentially indicates the distribution of the vertical differences between actual…
Q: A study was conducted to demonstrate that soybeans inoculated with nitrogen-fixing bacteria yield…
A: Given: There are 8 inoculated plants (I) and 8 uninoculated plants (U). Sample number I U 1…
Q: What does it mean when sampling is done without replacement? Choose the correct answer below. O A.…
A: The question is about sampling Introduction : Sampling with replacement : It is a method in which…
Q: Estimate the monthly sales if monthly advertising expenditure is 9900 dollars
A: Linear Regression model consist of one dependent and one independent variable.
Q: Define the null and alternative hypothesis for this test in mathematical terms and in words ,report…
A: Given that, Let μ be the population mean diameter of the ball bearing. Sample size (n) = 50…
Q: The side effects of a new drug are being tested against a placebo. A simple random sample of 565…
A:
Q: The companies of a county are summarized according to their patent applications and revenues in the…
A: Given data: Patent Application\ Revenues 0-250,000€ 250,000€-500,000€ More than 500,000€ 0-5…
Q: Would you use a sample or census to measure each of the following?
A: Identify if the given situation is census or sample.
Q: Find a 99% confidence interval in the difference of the means. Use technology to find the critical…
A:
Q: The E value of, i.e. +/- 5% in determining sample size is the maximum error in the estimate of p…
A: The margin of error ( maximum estimated error) is desired as a): Precision b): confidence level…
Q: BEING SPECIFIC, what kind of statistical analysis should you perform, and WHY? Three parts of your…
A: Given is the question to decide which statistical should be performed.
Q: The first objective of nonconforming chart is to determine the which is essential as a benchmark a.…
A: What is the first objective of nonconforming chart is to determine?
Q: A standardized test has a pop. mean of 152 and a standard deviation of 16. Nicole has a score of…
A: From the provided information, Mean (µ) = 152 Standard deviation (σ) = 16 X~N (152, 16) Nicole has…
Q: A simulation for rolling two number cubes is run with 50 trials. The results are shown below. (4,6)…
A:
Q: Suppose that the index model for two Canadian stocks HD and ML is estimated with the following…
A: Given: RHD =-0.03+2.10RM+eHD R-squared =0.7 RML =0.06+1.60RM+eML R-squared =0.6 σM =0.15
Q: Sketch the scatter plot using the table of bivariate data below. Describe the association between…
A: The data table provided in the question is as follows : x y 8 5 2 8 6 4 3 5 8 6 4 4…
Q: I'm using all the steps I've learned in getting the boundaries. The problem I'm working on is…
A: Given that Class interval=13.3-16.5
Q: ard deviation of $.40 per hour. At a .05 significance level, can we conclude the mean factory…
A:
Q: A Cp value less than 1.00 indicates that process is: a. Not Capable b. Process is capable c. Process…
A: Given that A Cp value less than 1.00 indicates that process
Q: Find the 18th percentile, P18, from the following data 1000 1300 1400 2000 2100 2400 2500 2700 2900…
A: Given,sample size(n)=38given data is already arranged in ascending order.
Q: Here is a set of sample data 6 7 8 14 18 19 21 25 40 42 44 51 52 57 58 59 63 75 77 87 95 97 98…
A: data are in accending orderno. of observations (n) = 23we have to find five number summary.
Q: Please examine the graph below, which is a histogram summarizing a sample of data. What can we…
A: we have to identify true statement about the shape of given histogram . histogram :…
Q: Imagine that a team of researchers collects basic information from every student in a large high…
A: Given information, A team researcher collects basic information from every students in large high…
Q: 12. The following dotplot shows the results from a previous class. The average word 1 is the Average…
A: Given Information:- Population mean for word length = 4.3 letters
Q: A teacher gives the following assignment to 200 students: Check the local newspaper every morning…
A: Given that Number of students=200 Population mean=85 Standard deviation=8 We have to find a. How…
Q: Average starting salaries for students using a placement service at a university have been steadily…
A: Given that graduating classes indicates the following average salaries: $30,000, $32,000, $34,500,…
Q: Assume that a sample is used to estimate a population mean μ. Find the margin of error M.E. that…
A: Given that n=83, x¯=48.8, s=8.2, confidence level=0.95. In this problem, σ is unknown. The…
Q: Find the 94th percentile, P94, from the following data 10.2 10.6 10.7 13.9 14.2 14.7 18.8 19 29 30.2…
A: we have to find 94th percentile sample size(n) = 31 formula to find percentile:…

Step by step
Solved in 4 steps with 1 images

- 1. Suppose that, in Example 2.27, 400 units of food A, 600 units of B, and 600 units of C are placed in the test tube each day and the data on daily food consumption by the bacteria (in units per day) are as shown in Table 2.6. How many bacteria of each strain can coexist in the test tube and consume all of the food? Table 2.6 Bacteria Strain I Bacteria Strain II Bacteria Strain III Food A 1 2 0 Food B 2 1 1 Food C 1 1 2Use this data and create a model that estimates a student's giving rate as an alumni based on the three parameters provided. If a class has a graduation rate of 74, the % of classes under 20 student equal to 55, and a Student=Faculty Ratio of 19, what should we expect our Alumni Giving Rate to be? (Enter a whole number) University Graduation Rate % of Classes Under 20 Student-Faculty Ratio Alumni Giving Rate Boston College 85 39 13 25 Brandeis University 79 68 8 33 Brown University 93 60 8 40 California Institute of Technology 85 65 3 46 Carnegie Mellon University 75 67 10 28 Case Western Reserve Univ. 72 52 8 31 College of William and Mary 89 45 12 27 Columbia University 90 69 7 31 Cornell University 91 72 13 35 Dartmouth College 94 61 10 53 Duke University 92 68 8 45 Emory University 84 65 7 37 Georgetown University 91 54 10 29 Harvard University 97 73 8 46 Johns Hopkins University 89 64 9 27 Lehigh University 81 55 11 40 Massachusetts Inst.…Section 11.2 Question #9 In soccer, serious fouls result in a penalty kick with one kicker and one defending goalkeeper. The accompanying table summarizes results from 278 kicks during games among top teams. In the table, jump direction indicates which way the goalkeeper jumped, where the kick direction is from the perspective of the goalkeeper. Use a 0.05 significance level to test the claim that the direction of the kick is independent of the direction of the goalkeeper jump. Do the results support the theory that because the kicks are so fast, goalkeepers have no time to react, so the directions of their jumps are independent of the directions of the kicks? View the penalty kick data. Pentalty kick data Dialog content starts Goalkeeper Jump Left Center Right Kick to Left 54 0 36 Kick to Center 41 10 28 Kick to Right 41 6 62 Determine the test statistic. χ2=____________(Round to three…
- A company claims that its brand of dish detergent, A, is more effective than a competitor’s brand, B. Fifty dirty dishes are randomly selected and randomly divided into two groups. In one group, each dirty dish will be placed in a container of hot water with Brand A detergent and in the other group, each dirty dish will be placed in a container of hot water with Brand B detergent. The dishes will sit for two hours, and then the cleanliness of the dishes will be measured using a scale of 1–10 (1 = least clean to 10 = most clean). The difference in mean cleanliness ratings for the two detergents (A – B) will then be calculated. What is the appropriate inference procedure?A study regarding the average cost of online streaming services in two states (A and B) is conducted. The results are shown in the following table. X and Y are independent.5. A consumer buying cooperative tested the effective heating area of 20 different electric space heaters with different wattages. Here are the results. Heater Wattage Area 1 750 291 2 1,750 83 3 1,250 215 4 1,750 209 5 1,500 295 6 750 153 7 1,000 40 8 750 166 9 1,250 115 10 1,250 146 11 750 113 12 1,000 56 13 1,750 284 14 1,000 45 15 750 82 16 1,250 175 17 750 150 18 1,500 231 19 1,000 87 20 750 52 Click here for the Excel Data FileRequired:a. Compute the correlation between the wattage and heating area. Is there a direct or an indirect relationship? (Round your answer to 4 decimal places.) b. Conduct a test of hypothesis to determine if it is reasonable that the coefficient is greater than zero. Use the 0.050 significance level. (Round intermediate calculations and final answer to 3 decimal places.)H0: ρ ≤ 0; H1: ρ > 0 Reject H0 if t > 1.734…
- 2- An expert estimates that the distribution parameter for durability times of parts produced with machine A in the factory is different from the distribution parameter for durability times of parts produced with machine B. Durability times of 4 parts produced from machine A and 4 parts produced from machine B are given below. Find the Mann-Whitney U value by using these data. a) 18 B) 6 NS) 16 D) 20 TO) 124) Here are data on the lengths of male and female roaches (in mm). Your job is to find out if there is adifference between male and female roaches (this should be two sided - why?).males 15.4 13.9 12.7 9.6 6.6 10.7 9.9 13.3 16.2 9.0 11.4 16.6 12.2females 16.7 16.3 12.8 16.9 15.1 12.8 18.7 18.3 8.6 13.6 15.3 16.2 13.4It's up to you to figure out what the best procedure is, what kind of hypotheses to use, which α to use,what test to use, and so on. Make sure you follow all the appropriate steps. You should probably use Ras you’ll get done much quicker. Remember to very clearly state your results in writing. Never turn in just an R printout .Hint: how do you decide which test to use? What kind of distributions do the data have?A consumer buying cooperative tested the effective heating area of 20 different electric space heaters with different wattages. Here are the results. Heater Wattage Area 1 1,000 290 2 750 292 3 1,500 148 4 1,250 246 5 1,250 203 6 750 85 7 1,250 237 8 1,000 139 9 1,500 64 10 1,000 171 11 1,750 163 12 1,250 175 13 750 264 14 1,500 50 15 1,750 163 16 1,500 177 17 1,250 118 18 1,750 122 19 1,000 144 20 1,500 103 Click here for the Excel Data File Compute the correlation between the wattage and heating area. Is there a direct or an indirect relationship? (Round your answer to 4 decimal places.) Conduct a test of hypothesis to determine if it is reasonable that the coefficient is greater than zero. Use the 0.025 significance level. (Round intermediate calculations and final answer to 3 decimal places.) H0: ρ ≤ 0; H1: ρ > 0 Reject H0 if t…