14. In the following table, profit earned is given from the number of companies belonging to two areas A and B. Draw in the same diagram their Lorenz curves and interpret them. Profit earned (in thousands) 5 26 65 89 110 155 180 200 Number of Companies Area A 7 12 14 28 33 25 18 8 Area B 13 25 43 57 45 28 13 6
14. In the following table, profit earned is given from the number of companies belonging to two areas A and B. Draw in the same diagram their Lorenz curves and interpret them. Profit earned (in thousands) 5 26 65 89 110 155 180 200 Number of Companies Area A 7 12 14 28 33 25 18 8 Area B 13 25 43 57 45 28 13 6

Principles of Economics 2e
2nd Edition
ISBN:9781947172364
Author:Steven A. Greenlaw; David Shapiro
Publisher:Steven A. Greenlaw; David Shapiro
Chapter15: Poverty And Economic Inequality
Section: Chapter Questions
Problem 38CTQ: Explain a situation using the supply and demand for skilled labor 111 which the increased number of...

Related questions
Question
Can you do this on excel? Please give me step by step solution on how to make it. Thanks
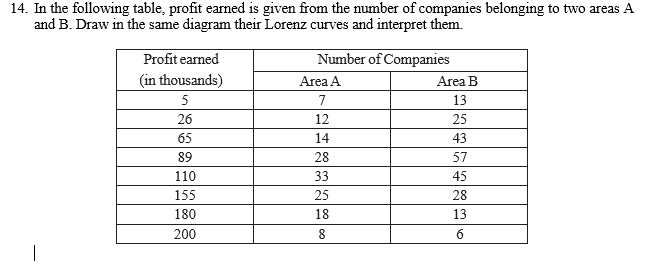
Transcribed Image Text:14. In the following table, profit earned is given from the number of companies belonging to two areas A
and B. Draw in the same diagram their Lorenz curves and interpret them.
Profit earned
(in thousands)
5
26
65
89
110
155
180
200
Number of Companies
Area A
7
12
14
28
33
25
18
8
Area B
13
25
43
57
45
28
13
6
Expert Solution
This question has been solved!
Explore an expertly crafted, step-by-step solution for a thorough understanding of key concepts.

Step by step
Solved in 4 steps with 3 images

Knowledge Booster


Learn more about
Need a deep-dive on the concept behind this application? Look no further. Learn more about this topic, economics and related others by exploring similar questions and additional content below.Recommended textbooks for you
Principles of Economics 2e
Economics
ISBN:
9781947172364
Author:
Steven A. Greenlaw; David Shapiro
Publisher:
OpenStax

Principles of Economics 2e
Economics
ISBN:
9781947172364
Author:
Steven A. Greenlaw; David Shapiro
Publisher:
OpenStax