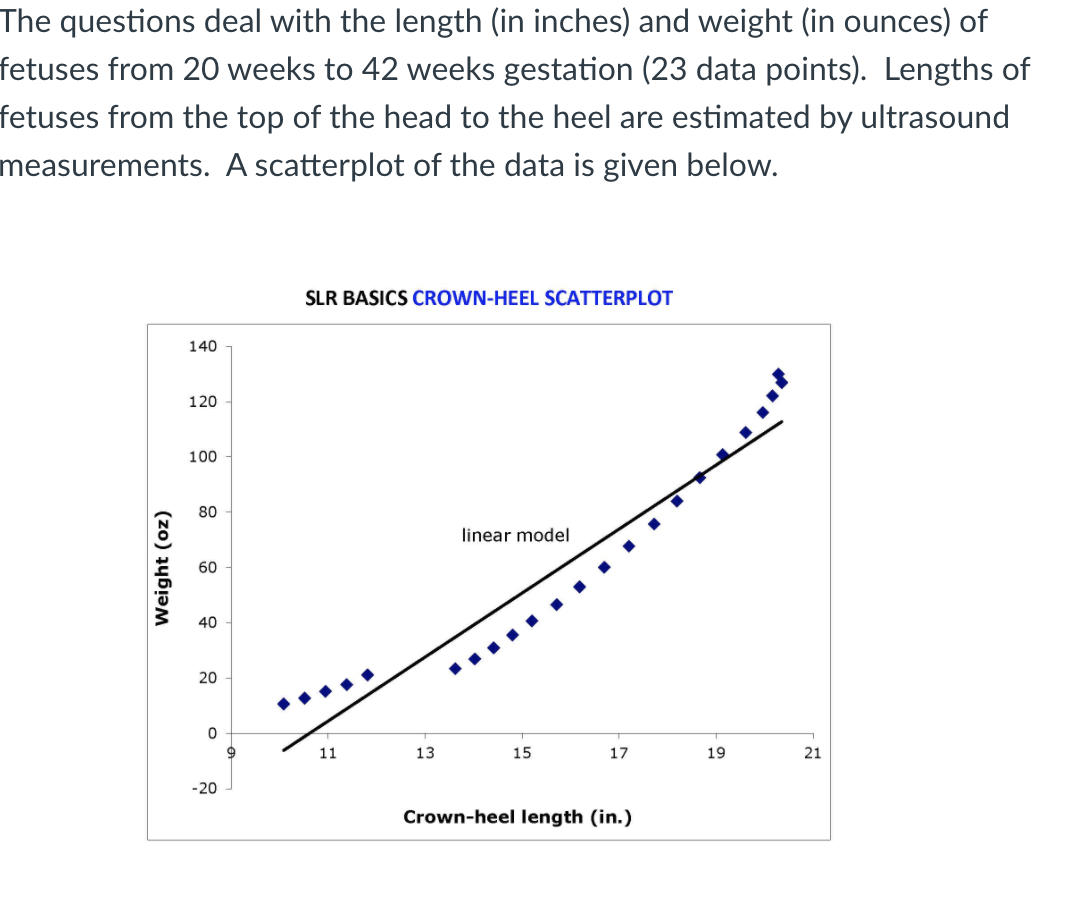
140 120 100 80 linear model 60 40 20 11 13 15 17 19 21 Weight (oz)

Glencoe Algebra 1, Student Edition, 9780079039897, 0079039898, 2018
18th Edition
ISBN:9780079039897
Author:Carter
Publisher:Carter
Chapter10: Statistics
Section10.5: Comparing Sets Of Data
Problem 13PPS
icon
Related questions
Topic Video
Question
CROWN-HEEL
R2 for the linear model was about 92%. Choose the BEST interpretation of
that number.
About 92% of the variation in weight is explained by the association with crown-
heel length.
O About 92% of the variation in weight is explained by the linear association with
crown-heel length.
O About 92% of the variation in crown-heel length is explained by the linear
association with weight.
About 92% of the variation in crown-heel length is explained by the association
with weight.
Transcribed Image Text:CROWN-HEEL R2 for the linear model was about 92%. Choose the BEST interpretation of that number. About 92% of the variation in weight is explained by the association with crown- heel length. O About 92% of the variation in weight is explained by the linear association with crown-heel length. O About 92% of the variation in crown-heel length is explained by the linear association with weight. About 92% of the variation in crown-heel length is explained by the association with weight.
The questions deal with the length (in inches) and weight (in ounces) of
fetuses from 20 weeks to 42 weeks gestation (23 data points). Lengths of
fetuses from the top of the head to the heel are estimated by ultrasound
measurements. A scatterplot of the data is given below.
SLR BASICS CROWN-HEEL SCATTERPLOT
140
120
100
80
linear model
60
40
20
11
13
15
17
19
21
-20
Crown-heel length (in.)
Weight (oz)
Transcribed Image Text:The questions deal with the length (in inches) and weight (in ounces) of fetuses from 20 weeks to 42 weeks gestation (23 data points). Lengths of fetuses from the top of the head to the heel are estimated by ultrasound measurements. A scatterplot of the data is given below. SLR BASICS CROWN-HEEL SCATTERPLOT 140 120 100 80 linear model 60 40 20 11 13 15 17 19 21 -20 Crown-heel length (in.) Weight (oz)
Expert Solution
Step 1

R2 
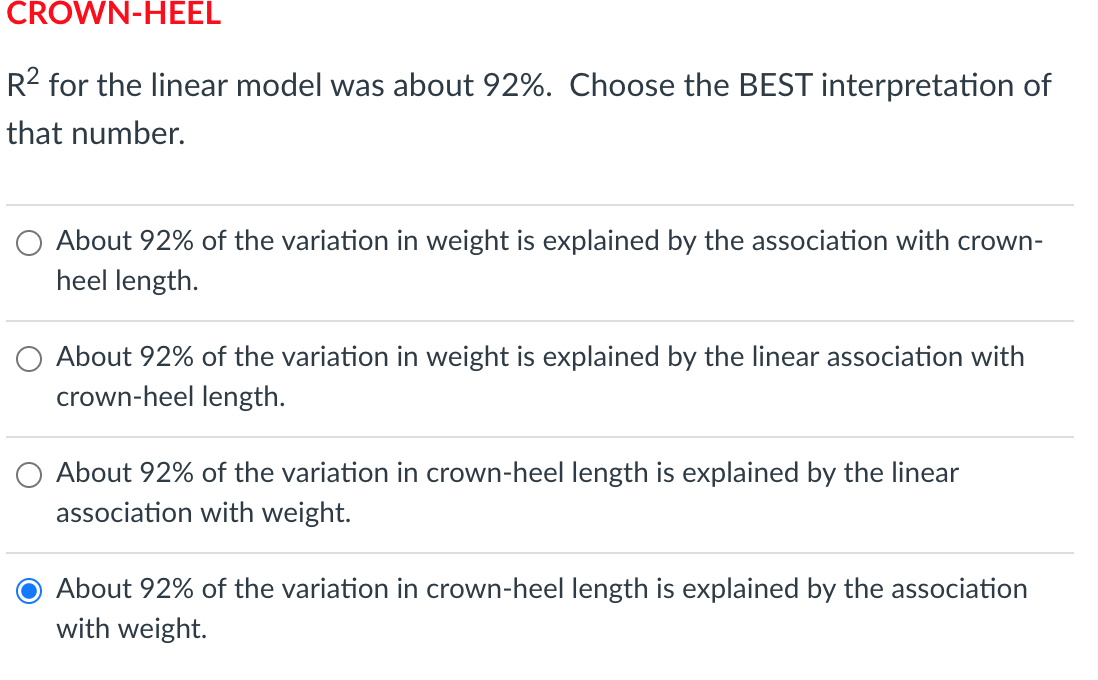
known as Coefficient of Determination, indicates the amount of variation in dependent variable Y with respect to the independent variable X. It is a goodness of fit measure for linear regression which measures the strength of the relationship between the two variables. Higher R -squared values represent smaller differences between the observed values and fitted values. It denotes the strength of the linear association between X and Y.

R-squared is the percentage of the dependent variable variation that a linear model explains. R2 is always between 0 and 100% where, 0% represents a model that does not explain any of the variation in the dependent variable, whereas 100% represents a model that explains all the variation in the dependent variable with respect to the independent variable.

steps

Step by step

Solved in 2 steps

Blurred answer
Knowledge Booster
Fundamentals of Trigonometric Identities
Learn more about
Need a deep-dive on the concept behind this application? Look no further. Learn more about this topic, statistics and related others by exploring similar questions and additional content below.
Recommended textbooks for you
Glencoe Algebra 1, Student Edition, 9780079039897…
Algebra
ISBN:
9780079039897
Author:
Carter
Publisher:
McGraw Hill
Functions and Change: A Modeling Approach to Coll…
Algebra
ISBN:
9781337111348
Author:
Bruce Crauder, Benny Evans, Alan Noell
Publisher:
Cengage Learning