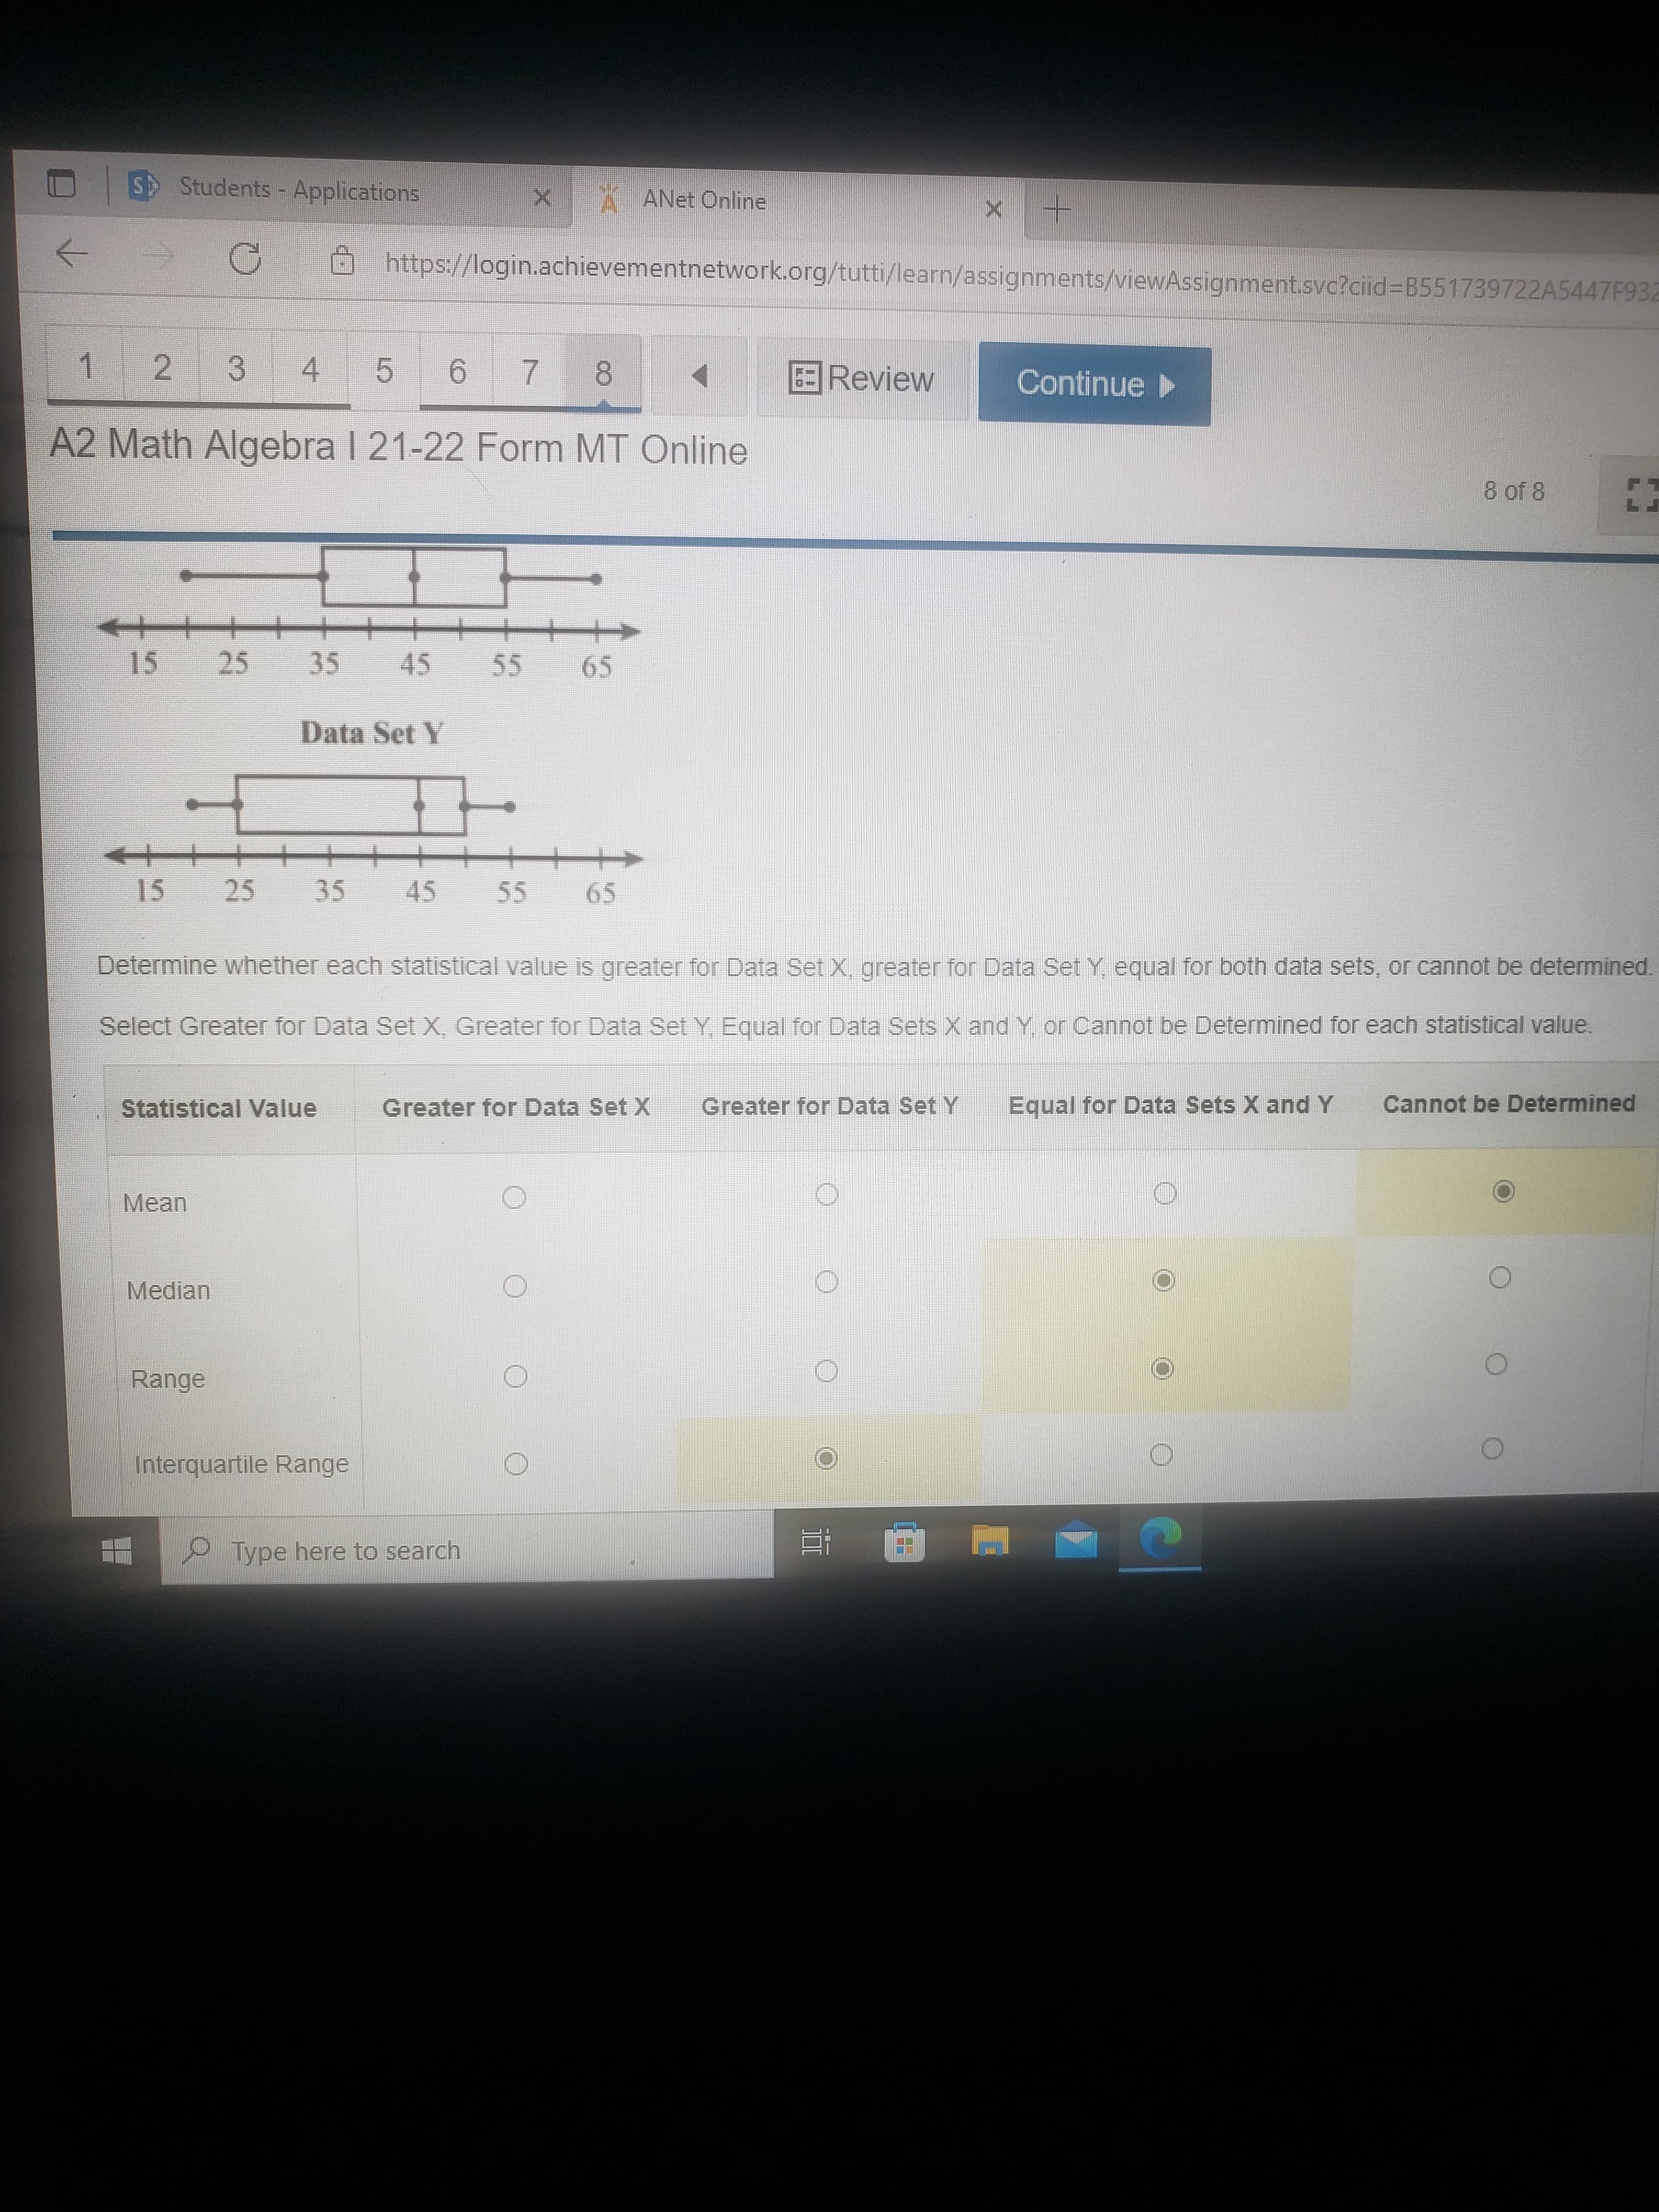
+++ 15 35 45 55 65 Data Set Y 15 25 35 45 55 65 Determine whether each statistical value is greater for Data Set X, greater for Data Set Y, equal for both data sets, or cannot be determined. 25


Q: In a construction company, there are three groups of engineers: civil, electrical and mechanical…
A: To check thatw which group has the highest variation. We've to find Variance for every group. We…
Q: 2. Which score has the highest relative position? a) x=12 Xm=10 s=4 b) x=170 Xm=120 s=32 c) x=180…
A:
Q: What is the value of the mode when all values in the data set are different A 0 B Cannot be…
A:
Q: s how it works?
A: Survival Analysis: Survival analysis is a model for time until a certain “event.” The event is…
Q: A waiter recorded the amount of money he earned in tips each weekday for a two-week period. His data…
A: from the questionwe have given a table which shows the amount ofmoney waiter earned in two works…
Q: State whether the data described below are discrete or continuous, and explain why.The widths (in…
A: Discrete data means, The data which is based on only a finite number of values that is variable…
Q: The boxplot below shows salaries for Actuaries and CPAS. СРА Actuary 50 60 70 80 90 100 io 30 40…
A: Determine who makes more money among Karina and Chasity. The correct option is identified below as…
Q: In a construction company, there are three groups of engineers: civil, electrical and mechanical…
A:
Q: СРА Actuary 30 35 40 45 50 55 60 65 70 75 80 85 Salary (thousands of $)
A:
Q: You may need to use the appropriate technology to answer this question. Consider the data. X; 2 6 9…
A: Procedure to conduct regression analysis using Excel: Enter the data of x and y in an excel sheet.…
Q: A researcher wonders whether males get paid more, on average, than females at a large firm. She…
A: Hello! As you have posted more than 3 sub parts, we are answering the first 3 sub-parts. In case…
Q: The boxplot below shows salaries for Construction workers and Teachers. Construction Teacher T 20 25…
A:
Q: Sweatshirt Sales vs. Temperature 300 250 200 150 100 50 10 30 Temperature (°F) 20 40 50 Sweatshirts…
A:
Q: For the data : 9 2 10 33 62 the mean is the best measure of central tendency to describe the data. O…
A: The data is 9, 2, 10, 33, 1, 62.
Q: Determine whether the data set represents a direct variatión, ail y 420 х 2 3 280 4. 210 Direct…
A: Answer: G. Inverse variation.
Q: Suppose the correlation between the amount of salt consumed daily and blood pressure is +0.73. What…
A:
Q: Which equation best represents this data set? {(-4, -4.8), (-3, -8.2), (-2, -9.1), (-1, -8.1), (0,…
A:
Q: ticket price (dollars) number of tickets sold revenue (dollars) 10 15 20 30 45 50 5.
A:
Q: The boxplot below shows salaries for CPAS and Actuaries in a town. СРА Actuary 20 30 40 50 60 70 80…
A: From the boxplot Median salary of CPA = 1st quartile of Actuaries
Q: You are given the following information about x and y. (Note: copy and paste the data in an Excel…
A: Coefficient of determination is denoted by r2
Q: Тах Usage X Y 20.72 616.51 21.53 643.42 15.1 431.99 23.12 268.98 18.89 837.88 29.79 616.1 The above…
A:
Q: Which set of data represents an inverse variation? A y 4 10 %3B 1.5 3 y 2.5 1.5 C 10 20 25 y 0.1 0.5…
A:
Q: For data with evenly spaced inputs, if the first differences are constant then a linear model is…
A: If yt is the value of y series at time t, then the first difference of y at time t is given by yt -…
Q: How does the fuel consumption of a car change as its speed increases? The table contains data for a…
A: The speed of the car depends on the fuel. So speed is dependent variable hence fuel is independent…
Q: mechanical engineers. The table below shows the number of engineers within each group. Which group…
A: Given data is:
Q: The number of books sold weekly for 6 Weeks by a book store 69 65 66 71 68 73 Class Frequency 61-65…
A: Formula to find midpoint is , Midpoint =Lower limit + upper limit2
Q: 2. A law enforcement officer obtained data on the performance rating of the police offices and the…
A:
Q: Test at the 5% level for a correlation between percentage spent on health expenditure and the…
A: Given: Consider the provided data that shows the information percentage of GDP spent on the health…
Q: 6. Open Ended Explain how any two points on the line.
A: Q.6) Open ended: Explain how it is possible to find the slope of a line given any two points on the…
Q: A MLR model is built to predict the Sales Price of a home (Y) from: Assessed Value (X1) Whether…
A: If a regression line has one independent variable it is known as simple linear regression. If the…
Q: In a construction company, there are three groups of engineers: civil, electrical and mechanical…
A: Given 3 groups of engineers within each age group as: civil electrical mechanical 11 5 8 17 8…
Q: The manager of a restaurant kept a record of the number y customers each hour, where x= 3 represents…
A: Given : x(time) y(customer) 3 9 4 24 5 44 6 54 7 52 8 44 9 34 10 22
Q: 3. Find the percentage of data points that lie between z1 picture to support your = -3.01 and z2 =…
A: Find the percentage of data points that lies between z1=-3.01 and z2=2.61. Find the graph for it?
Q: Strongly Agree Strongly Disagree Agree Neutral Disagree Control 39 46 2 13 12 Treatment 57 44 3 1
A: Here, we have to find the expected count and to find the contibution to the chi square statistic.
Q: The basketball coach at a local college believes that his team scores more points at home games when…
A: Let Score be denoted as x. Let Attendance be denoted as y. Calculate the following values. x y…
Q: An ATM machine works at the rate of 18 an hour . Ther service transaction rate is 12 customers…
A:
Q: The range of the set of data below is 20 92,81, 84, 79, 76, 95, 75, 82 O True O False
A: The range of a set of data is the difference between the highest and lowest values in the set.
Q: 50 45 40 35 30 25 20 15 10 5 10 15 20 25 30 35 40 45 50 20 50 35
A:
Q: ABC Inc. Is trying to predict sales (Y) based on marketing budget (X Use the data below to calculate…
A:
Q: The basketball coach at a local college believes that his team scores more points at home games when…
A: State the hypotheses. Use EXCEL to obtain the value correlation coefficient r: EXCEL procedure:…
Q: The basketball coach at a local college believes that his team scores more points at home games when…
A: Since you have posted multiple sub-parts, we will solve the first three sub-parts for you. To get…
Q: Attendance 155 170 200 188 1) What is the value of Σz? Academic Performance 88 87 85 80
A: Given that, Attendance (x) Academic performance (y) 155 88 170 87 200 85 188 80 Denote…
Q: Temperature Chirps 54.5 81 59.5 97 63.5 103 67.5 123 72 150 78.5 182 195 Line of best fit:…
A: Wevhave to find that the Y intercept a reasonable part of the model or not.
Q: Find the average price and med Price Per Number of Item Items $13 4 $16 $17 8. $22 6. Average price:…
A: the given data is as follows Price Per item (x) number of items (f) cumulative frequency cf 13…
Q: Determine the question (X) that converts each situation to Yes/No data. a) The proportion of cars…
A: Researchers conduct survey using questionnaire comprising both objective and subjective questions.
Q: The boxplot below shows salaries for Construction workers and Teachers. If a person is making the…
A: From the Boxplot for construction, the minimum salary for a construction worker is $30,000.
Q: 2. Frozen pizza Here are the number of calories per serving for 16 brands of frozen cheese pizza. 18…
A: Solution
Q: Part 5: Find the value of x 19) 20) 26 55 21) 22) 88 64" 23) 24) 9 12
A:
Q: In a construction company, there are three groups of engineers: civil, electrical and mechanical…
A: The table with class mark is given by: Class Class mark(xi) fc fe fm xifc xife xifm xi-μc2 xi-μe2…


Trending now
This is a popular solution!

Step by step
Solved in 2 steps

- Kaitlyn measures the upload speed in megabits per second of her home broadband internet connection during peak hours and off-peak hours. The results are provided in the accompanying table. Peak Off-Peak 5.83 5.14 6.05 6.80 7.14 6.98 3.54 5.77 5.45 7.27 5.90 6.62 5.81 6.19 4.82 6.08 6.37 6.59 4.65 5.58 5.30 7.41 6.48 6.26 5.96 6.37 5.79 6.31 6.84 6.55 5.06 4.95 5.61 7.03 6.45 6.77 Examine the results of Kaitlyn's test to determine the statements that compare the medians and interquartile ranges of the data sets to each other in terms of this situation. Select the two correct answers. The median upload speed during peak hours is 5.905 megabits per second, which is less than the median upload speed during off-peak hours, 7.005 megabits per second. The upload speeds during peak hours are slower on average compared to off-peak times. The median upload speed during peak hours is 6.37 megabits per second, which is greater than the median upload speed during…A manufacturer claims that the tensile strength of a certain composite (in MPa) has the lognormal distribution with μ = 5 and σ = 0.5. Let X be the strength of a randomly sampled specimen of this composite. a) If the claim is true, what is P(X < 20)? b) Based on the answer to part (a), if the claim is true, would a strength of 20 MPa be unusually small? c) If you observed a tensile strength of 20 MPa, would this be convincing evidence that the claim is false? Explain. d) If the claim is true, what is P(X < 130)? e) Based on the answer to part (d), if the claim is true, would a strength of 130 MPa be unusually small? f) If you observed a tensile strength of 130 MPa, would this be convincing evidence that the claim is false? Explain.The article “Withdrawal Strength of Threaded Nails” (D. Rammer, S. Winistorfer, and D. Bender, Journal of Structural Engineering 2001:442–449) describes an experiment comparing the ultimate withdrawal strengths (in N/mm) for several types of nails. For an annularly threaded nail with shank diameter 3.76 mm driven into spruce-pine-fir lumber, the ultimate withdrawal strength was modeled as lognormal with μ = 3.82 and σ = 0.219. For a helically threaded nail under the same conditions, the strength was modeled as lognormal with μ = 3.47 and σ = 0.272. a) What is the mean withdrawal strength for annularly threaded nails? b) What is the mean withdrawal strength for helically threaded nails? c) For which type of nail is it more probable that the withdrawal strength will be greater than 50 N/mm? d) What is the probability that a helically threaded nail will have a greater withdrawal strength than the median for annularly threaded nails? e) An experiment is performed in which withdrawal…
- Consider the following panel model to examine the effect of retirement on consumption expenditure, consit, of individual i over years t=1,…,3: (B1) log(consit) = β0 + β1retiredit + β2ageit + β3marriedit + β4healthit + δ1Yr2t + δ2Yr3t + ai + uit Where: retiredit is a dummy variable equal to 1 if individual i is retired on year t and 0 otherwise ageit is the individual's age in years marriedit is an indicator variable for whether the individual is married (1) or not (0) in year t healthit is an indicator variable equal to 1 if the individual is in 'good health' and 0 otherwise Yr2 is a dummy variable equal to 1 in year t=2 and 0 otherwise Yr3 is a dummy variable equal to 1 in year t=3 and 0 otherwise Using the information above, answer the following 3 questions. [i] Give two (2) examples of the kind of variables captured by the term ai in Model (B1). [ii] What is the crucial assumption we must make so that the random effects (RE) estimator is consistent? Under this assumption, why is…Listed below are amounts of strontium-90 (in millibecquerels, or mBq) in a simple random sample of baby teeth obtained from residents in a region born after 1979. Use the given data to construct a boxplot and identify the 5-number summary. 122 123 125 129 132 134 134 137 140 142 144 146 147 149 151 156 158 158 162 167 The 5-number summary is nothing, nothing, nothing, nothing, and nothing, all in mBq. (Use ascending order. Type integers or decimals. Do not round.)Since the Cobot’s gripper is a critical component, a reliability of 99% is desired for that component. The failure time, in hours, of the cobot’s gripper follows a lognormal distribution with µt=10.52 and σt= 1.44. the gripper is considered a consumable item (i.e., if failed, the gripper is replaced, not repaired. a. What is the MTTF? b. At what number of hours of use should the gripper be replaced to meet the desired 99% reliability?
- Based on data collected by the U.S. General Social Survey, a researcher examines the frequency with which adults responded to two questions. The first asked people if they resided in the same city or town now as when they were 16 years old (Residence). The second asked if they found life generally exciting, routine, or dull (Life). Using data from 2,791 people, the results are below. Life is Generally: Living in: Exciting Routine Dull Marginal n Same City or Town O = 489 E = O = 601 E = O = 64 E = 1154 Different Area O = 797 E = O = 763 E = O = 77 E = 1637 Marginal n 1286 1364 141 2791 Using the chi-square (χ2) test for independence, examine if the feelings people have about life in general are related to living in the same city or town as when a teen. State the hypotheses (H0 and H1). Find the critical value for α = .05, 1-tailed. Calculate the test statistic (χ2), filling in relevant portions of the…Listed below are amounts of strontium-90 (in millibecquerels, or mBq) in a simple random sample of baby teeth obtained from residents in a region born after 1979. Use the given data to construct a boxplot and identify the 5-number summary. a. The 5-number summary is all in mBq. (Use ascending order. Type integers or decimals. Do not round.) b. Which boxplot below represents the data?A poll found that 15% of adults do not work at all while on summer vacation. In a random sample of 8 adults, let x represent the number who do not work during summer vacation. Complete parts a through e.
- In a recent survey, ice cream truck drivers in Cincinnati, Ohio, reported that they make about $280 in income on a typical summer day. The income was generally higher on days with longer work hours, particularly hot days, and on holidays. The accompanying data file includes five weeks of the driver’s daily income (Income), number of hours on the road (Hours), whether it was a particularly hot day (Hot = 1 if the high temperature was above 85°F, 0 otherwise), and whether it was a Holiday (Holiday = 1, 0 otherwise). Income Hours Hot Holiday 196 5 1 0 282 8 0 0 318 6 1 0 232 5 1 0 276 8 0 0 312 8 0 1 193 5 0 1 110 4 0 0 321 8 1 0 283 8 0 0 325 8 1 0 247 7 0 1 398 8 1 1 448 8 1 1 214 4 0 0 235 8 0 0 238 8 0 0 148 3 1 0 313 8 0 1 449 8 1 1 332 8 1 1 247 8 0 0 363 7 1 0 393 7 1 1 254 8 0 0 228 8 0 0 355 6 1 1 248 7 0 1 291 8 1 0 255 5 1 0 239 6 0 0 181 6 0 0 222 7 0 0 170 5 0 1 374 6 1 1 1. Estimate the effect of…A research center claims that more than 26% of employees in a certain country have changed jobs in the past three years. In a random sample of 220 people from that country, 66 have changed jobs in the past three years. At α=0.01, is there enough evidence to support the center's claim? Complete parts (a) through (e) below.A group of six, obese adult men had their weights recorded both before and 10 months after having a diet treatment to help manage their weight. Observe the information presented in the table below: The weights of six obese adult men both before and 10-months after having a diet treatment Before Diet Treatment After Diet Treatment 250 240 225 215 220 198 311 300 326 298 205 205 Test at α = 0.05 the hypothesis that for the group, there was a statistically significant average decrease in weight from before diet treatment to 10 months after. Hint: This is hypothesis testing for paired samples. Here, you will use a paired t test.