15. The number of absences from June to March of a student based on his clas adviser's record is shown below. If X be the random variable. representing th number of absences. Month No. of Absences Month No. of Absences June November 2. July August September October December 1 January February March 3. 2. 4 Which table represents the probability distribution? A. 3. 2 3 P(X) 10 10 10 В. 1 3 3. 3 3 P(X} TO 10 10 10 1 3. 4. 3 P(X) 10 10 10 10 5. D. 2. 3 3. 4 P(X) 3. 1 10 10 10 10
15. The number of absences from June to March of a student based on his clas adviser's record is shown below. If X be the random variable. representing th number of absences. Month No. of Absences Month No. of Absences June November 2. July August September October December 1 January February March 3. 2. 4 Which table represents the probability distribution? A. 3. 2 3 P(X) 10 10 10 В. 1 3 3. 3 3 P(X} TO 10 10 10 1 3. 4. 3 P(X) 10 10 10 10 5. D. 2. 3 3. 4 P(X) 3. 1 10 10 10 10

Chapter8: Sequences, Series,and Probability
Section8.7: Probability
Problem 11ECP: A manufacturer has determined that a machine averages one faulty unit for every 500 it produces....

Related questions
Question
Answer number 15.
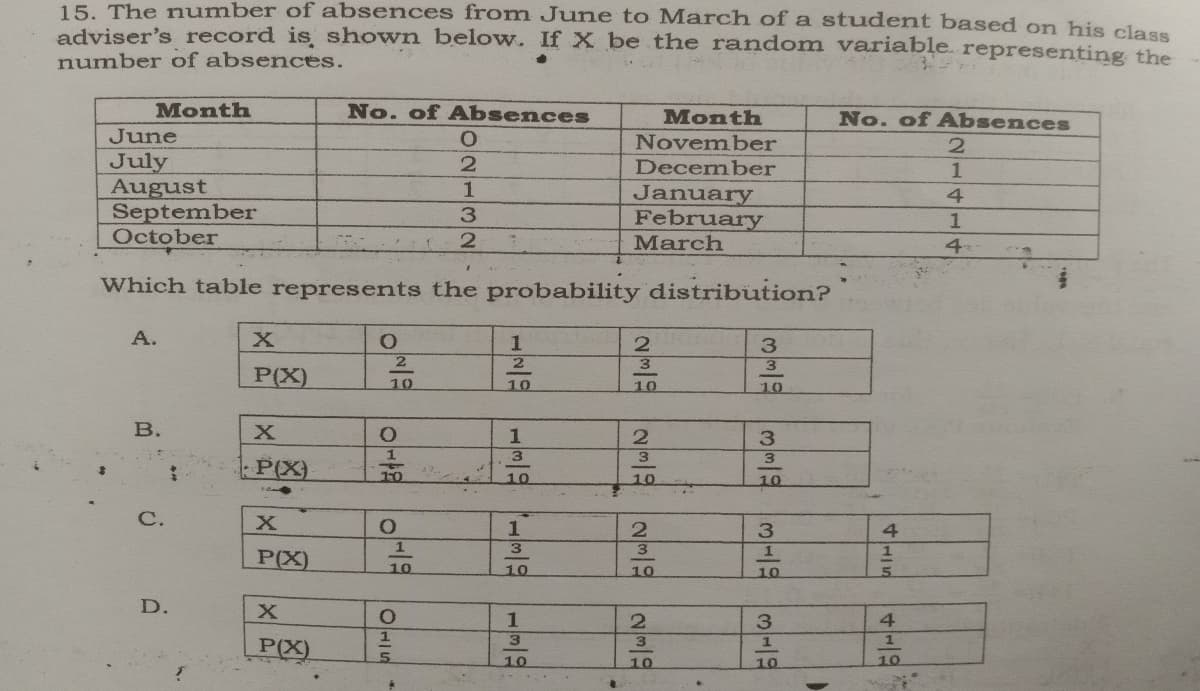
Transcribed Image Text:15. The number of absences from June to March ofa student based on his class
adviser's record is shown below. If X be the random variable. representing the
number of absences.
Month
No. of Absences
Month
No. of Absences
June
November
July
August
September
October
December
1
January
February
March
4
3.
4-
Which table represents the probability distribution?
A.
3.
2
P(X)
10
10
10
10
в.
1
3.
3
3
3
P(X)
10
10
10
C.
3
3
P(X)
10
10
10
10
D.
1
3
4
1
3
P(X)
10
10
10
10
4115
Expert Solution
This question has been solved!
Explore an expertly crafted, step-by-step solution for a thorough understanding of key concepts.

This is a popular solution!

Trending now
This is a popular solution!

Step by step
Solved in 2 steps

Recommended textbooks for you