
Algebra and Trigonometry (6th Edition)
6th Edition
ISBN:9780134463216
Author:Robert F. Blitzer
Publisher:Robert F. Blitzer
ChapterP: Prerequisites: Fundamental Concepts Of Algebra
Section: Chapter Questions
Problem 1MCCP: In Exercises 1-25, simplify the given expression or perform the indicated operation (and simplify,...

Related questions
Topic Video
Question
Need answer
Transcribed Image Text:E Edulastic Formative and Summ X
hstic.com/student/practicey517dd2bd6 505d6000774b53c/class/5f414d8d5dd16ded17756719/
A makinleymidkdlerna..
Assignments I Kha...
C Clever | Logging in
Videos
Home
tidunit Test
品|X
BOOKMARK
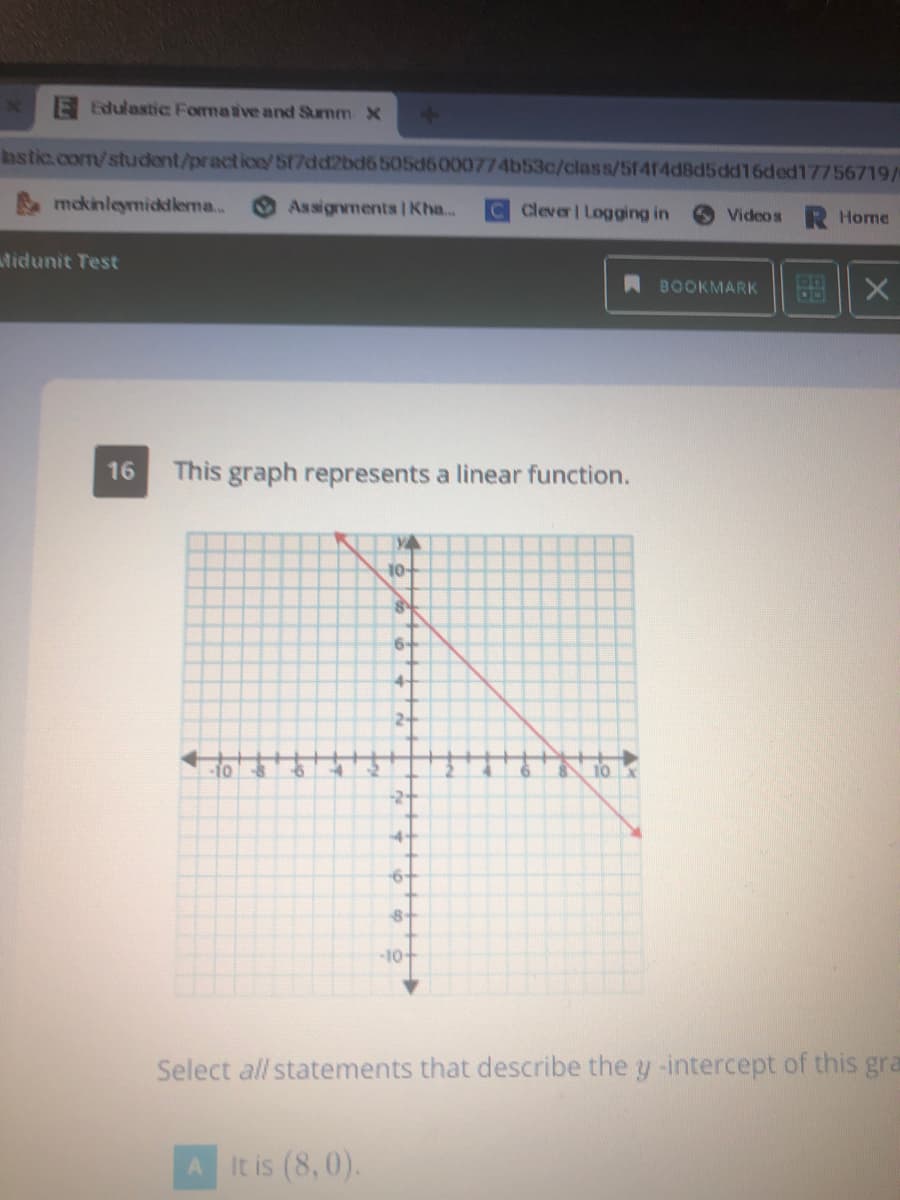
16
This graph represents a linear function.
10-
6-
2-
10
-2+
4+
10+
Select all statements that describe the y -intercept of this gra
It is (8,0).
Transcribed Image Text:E Edulastic Formative and Surmm X
app.cculastic.com/studont/practico/517dd2bd6505d6000774b53c/class/Sr414dd5dd16ded17756719/uta/585c653ad5a6r000885d519/qid/15
E clasroorn
E mdkinleyrnicklerna
O Assignments I Kha.
C devel Logging in
Videos
Home
Nearpod| Technolo
E Edulastic Formativ.
A Stud.
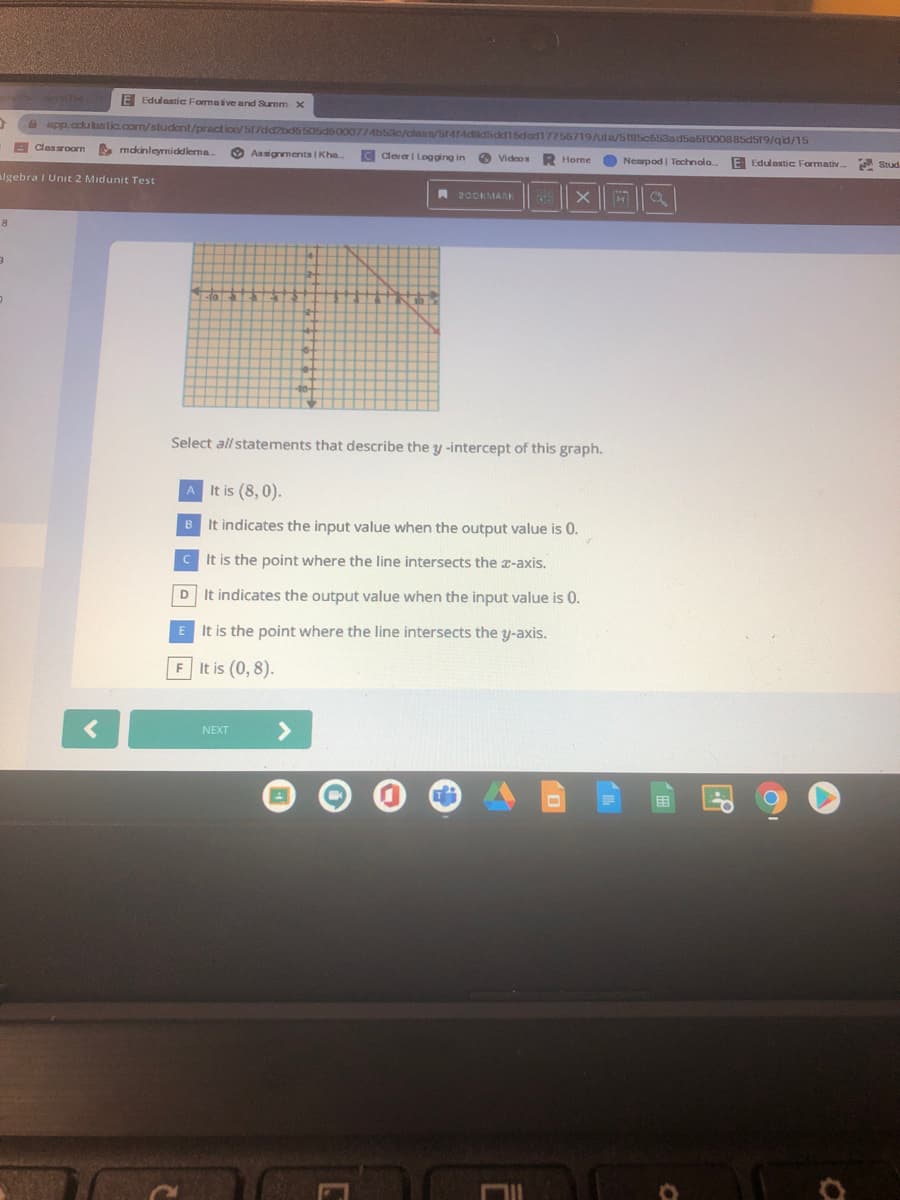
algebra I Unit 2 Midunit Test
RDOOKMARK
Select all statements that describe the y -intercept of this graph.
A It is (8, 0).
B It indicates the input value when the output value is 0.
C It is the point where the line intersects the a-axis.
D
It indicates the output value when the input value is 0.
E It is the point where the line intersects the y-axis.
F It is (0, 8).
<>
NEXT
Expert Solution
This question has been solved!
Explore an expertly crafted, step-by-step solution for a thorough understanding of key concepts.

This is a popular solution!

Trending now
This is a popular solution!

Step by step
Solved in 2 steps with 2 images

Knowledge Booster


Learn more about
Need a deep-dive on the concept behind this application? Look no further. Learn more about this topic, algebra and related others by exploring similar questions and additional content below.Recommended textbooks for you
Algebra and Trigonometry (6th Edition)
Algebra
ISBN:
9780134463216
Author:
Robert F. Blitzer
Publisher:
PEARSON

Contemporary Abstract Algebra
Algebra
ISBN:
9781305657960
Author:
Joseph Gallian
Publisher:
Cengage Learning

Linear Algebra: A Modern Introduction
Algebra
ISBN:
9781285463247
Author:
David Poole
Publisher:
Cengage Learning
Algebra and Trigonometry (6th Edition)
Algebra
ISBN:
9780134463216
Author:
Robert F. Blitzer
Publisher:
PEARSON
Contemporary Abstract Algebra
Algebra
ISBN:
9781305657960
Author:
Joseph Gallian
Publisher:
Cengage Learning
Linear Algebra: A Modern Introduction
Algebra
ISBN:
9781285463247
Author:
David Poole
Publisher:
Cengage Learning

Algebra And Trigonometry (11th Edition)
Algebra
ISBN:
9780135163078
Author:
Michael Sullivan
Publisher:
PEARSON

Introduction to Linear Algebra, Fifth Edition
Algebra
ISBN:
9780980232776
Author:
Gilbert Strang
Publisher:
Wellesley-Cambridge Press

College Algebra (Collegiate Math)
Algebra
ISBN:
9780077836344
Author:
Julie Miller, Donna Gerken
Publisher:
McGraw-Hill Education