16. At 95% confidence ( 0.05), determine which variables are significant and which are not. a. Both Shares Sold and NYSE Exchange are significant. b. Both Shares sold and NYSE Exchange are insignificant. Shares sold is significant and NYSE Exchange is insignificant. d. с. Shares sold is insignificant and NYSE Exchange is significant.
16. At 95% confidence ( 0.05), determine which variables are significant and which are not. a. Both Shares Sold and NYSE Exchange are significant. b. Both Shares sold and NYSE Exchange are insignificant. Shares sold is significant and NYSE Exchange is insignificant. d. с. Shares sold is insignificant and NYSE Exchange is significant.

Glencoe Algebra 1, Student Edition, 9780079039897, 0079039898, 2018
18th Edition
ISBN:9780079039897
Author:Carter
Publisher:Carter
Chapter10: Statistics
Section10.6: Summarizing Categorical Data
Problem 27PPS

Related questions
Question
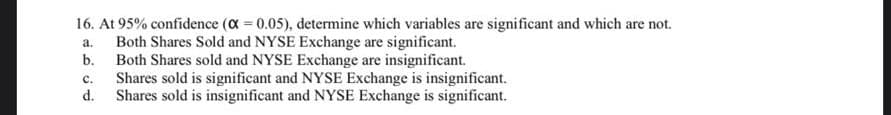
Transcribed Image Text:16. At 95% confidence (a 0.05), determine which variables are significant and which are not.
Both Shares Sold and NYSE Exchange are significant.
b.
a.
Both Shares sold and NYSE Exchange are insignificant.
Shares sold is significant and NYSE Exchange is insignificant.
d.
с.
Shares sold is insignificant and NYSE Exchange is significant.
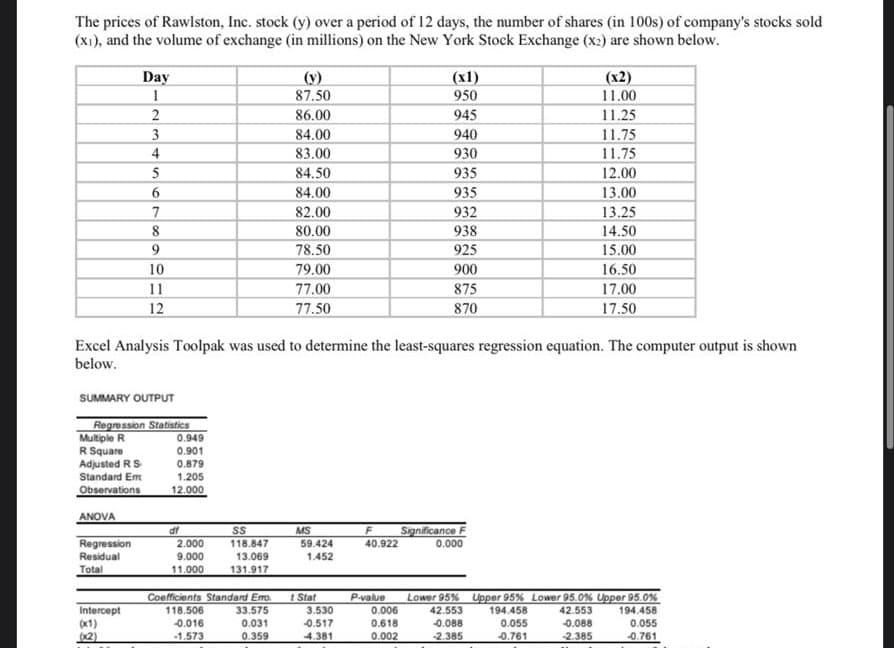
Transcribed Image Text:The prices of Rawlston, Inc. stock (y) over a period of 12 days, the number of shares (in 100s) of company's stocks sold
(x1), and the volume of exchange (in millions) on the New York Stock Exchange (x2) are shown below.
Day
(x1)
950
(x2)
(v)
87.50
11.00
2
86.00
945
11.25
3
84.00
940
11.75
11.75
4
83.00
930
5
84.50
935
12.00
6.
84.00
935
13.00
13.25
7
82.00
932
8
80.00
938
14.50
78.50
925
15.00
10
79.00
900
16.50
77.00
77.50
11
875
17.00
12
870
17.50
Excel Analysis Toolpak was used to determine the least-squares regression equation. The computer output is shown
below.
SUMMARY OUTPUT
Regression Statistics
Multiple R
R Square
0.949
0.901
Adjusted RS
Standard Em
Observations
0.879
1.205
12.000
ANOVA
df
MS
59.424
Significance F
SS
Regression
2.000
118.847
40.922
0.000
Residual
9.000
13.069
1.452
Total
11.000
131.917
Coefficients Standard Ero
118.506
0.016
33.575
0.031
t Stat
3.530
P-value
0.006
Lower 95% Upper 95% Lower 95.0% Upper 95.0%
194.458
194.458
Intercept
(x1)
(2)
42.553
42.553
-0.517
0.618
0.088
0.055
0.088
0.055
-1.573
0.359
4.381
0.002
-2.385
-0.761
2.385
-0.761
Expert Solution
This question has been solved!
Explore an expertly crafted, step-by-step solution for a thorough understanding of key concepts.

Step by step
Solved in 2 steps

Recommended textbooks for you
Glencoe Algebra 1, Student Edition, 9780079039897…
Algebra
ISBN:
9780079039897
Author:
Carter
Publisher:
McGraw Hill
Glencoe Algebra 1, Student Edition, 9780079039897…
Algebra
ISBN:
9780079039897
Author:
Carter
Publisher:
McGraw Hill