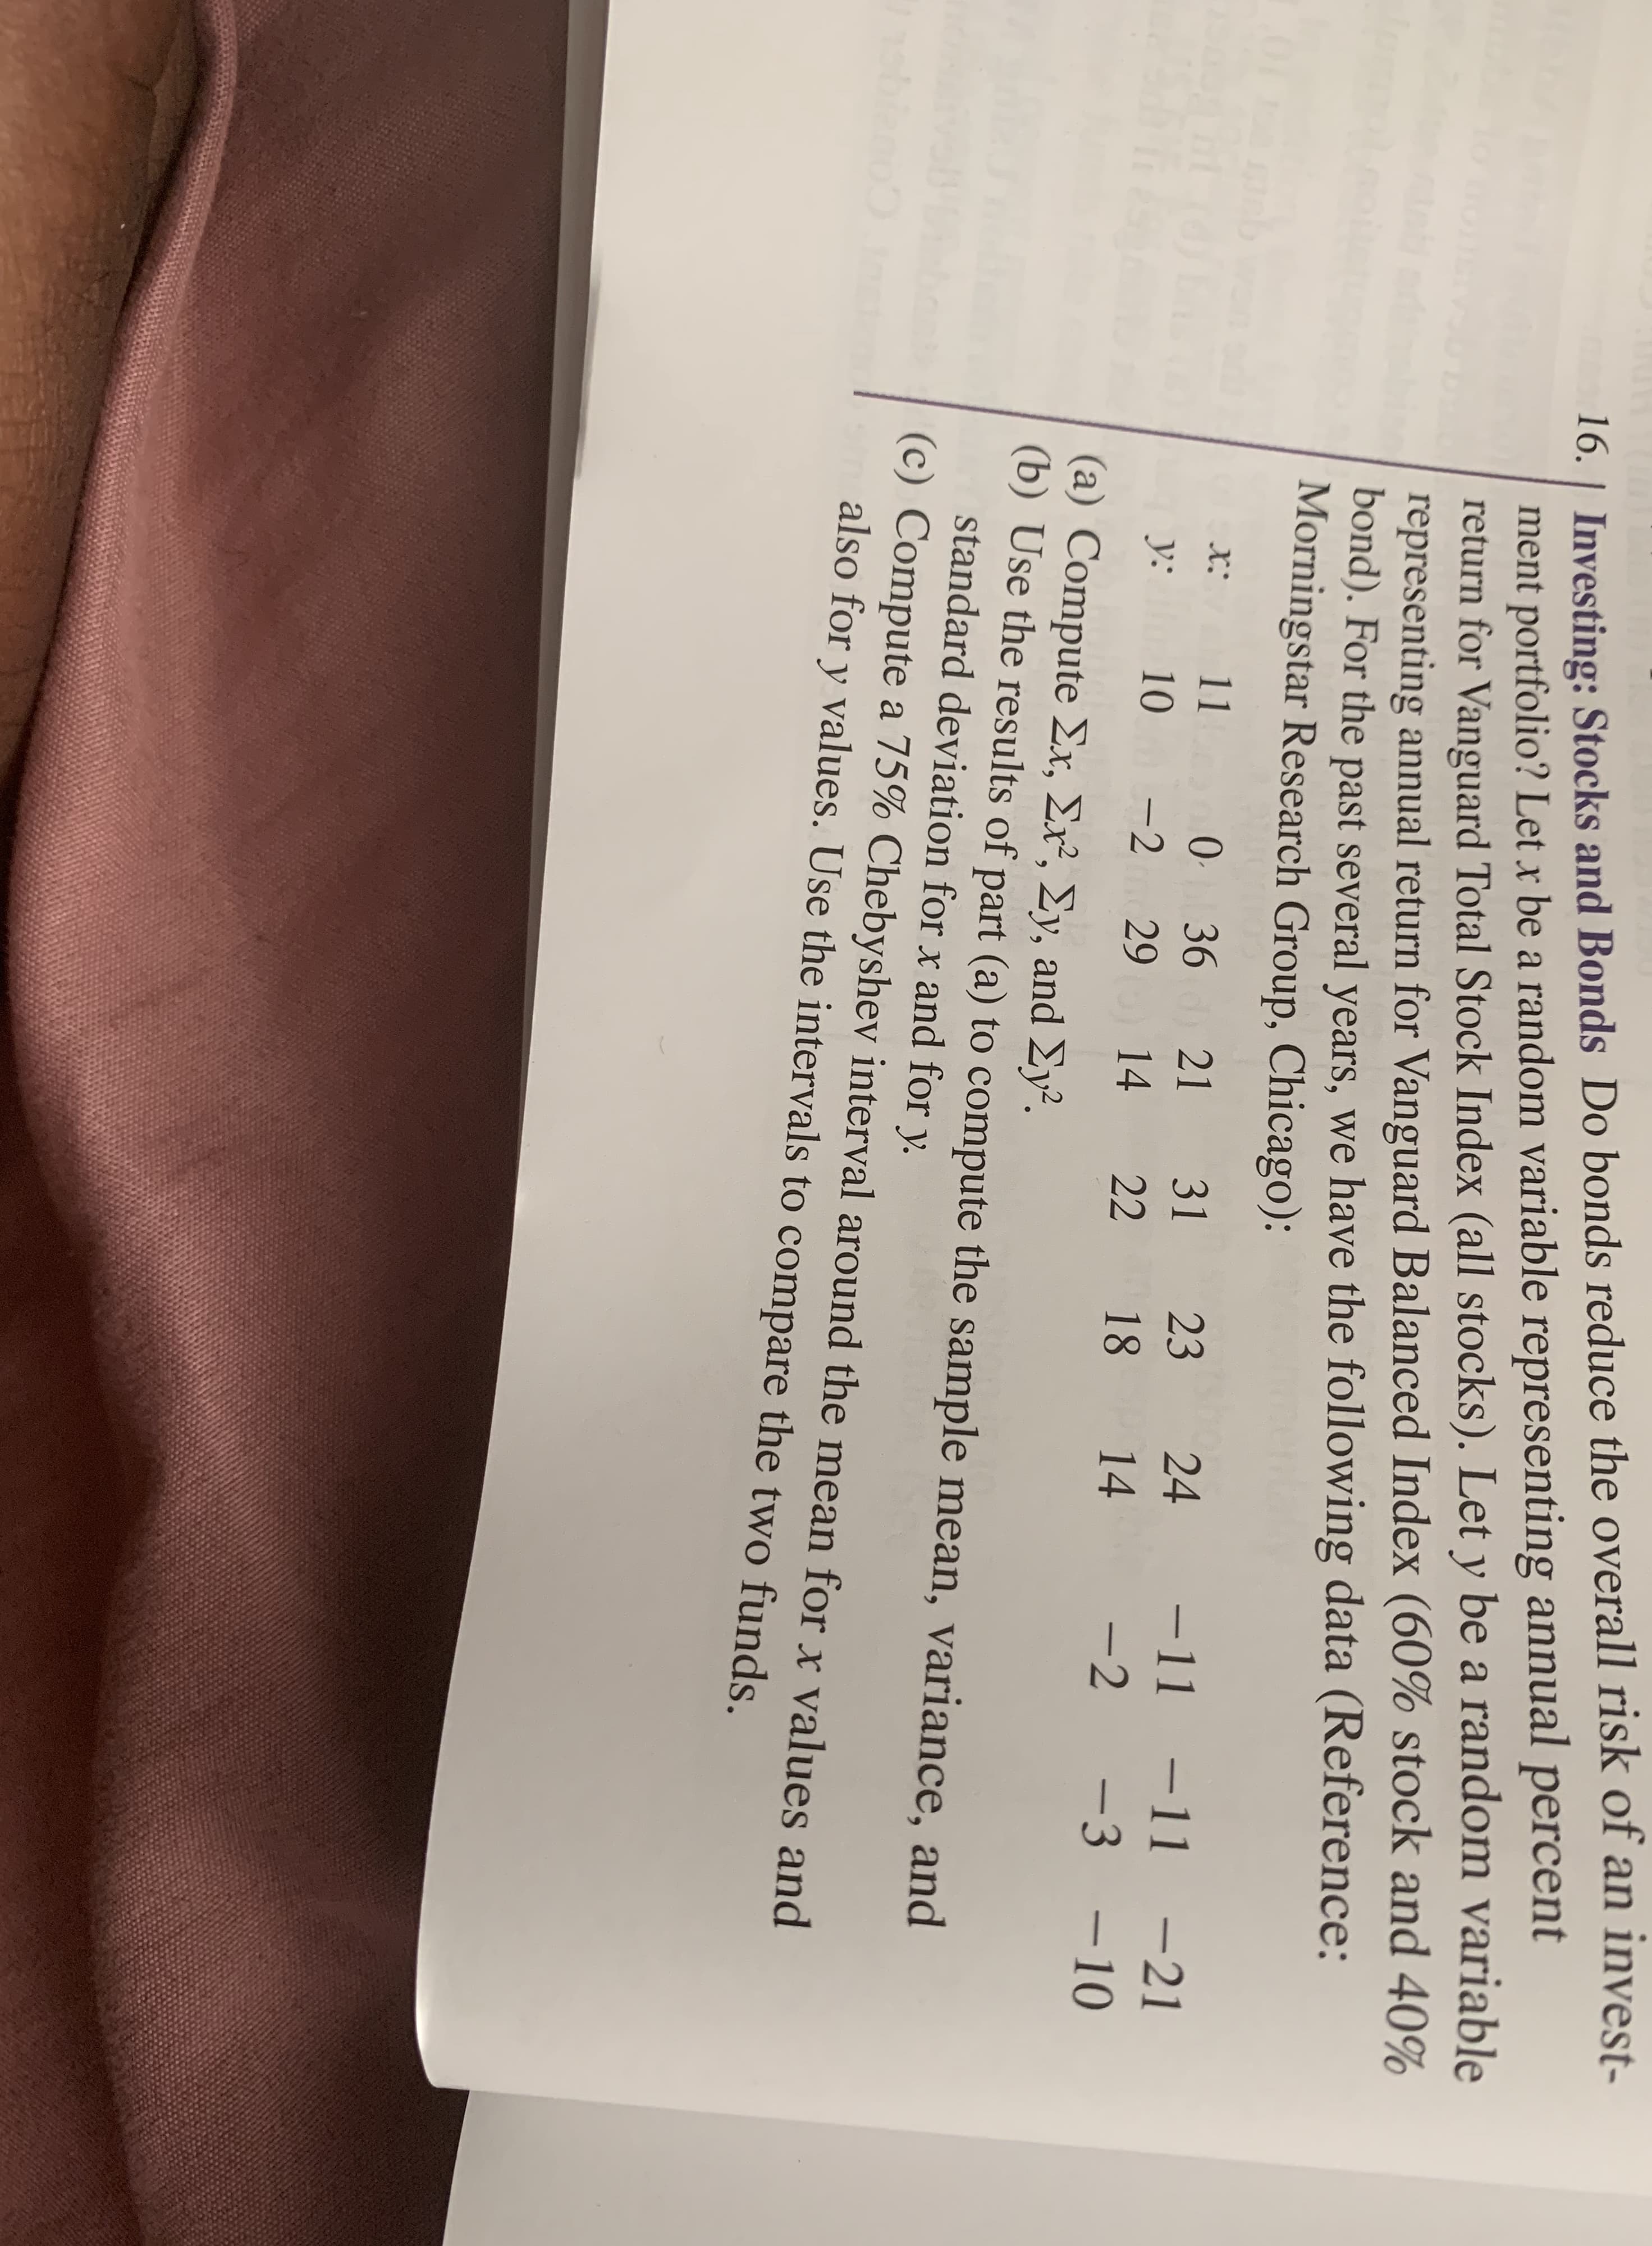
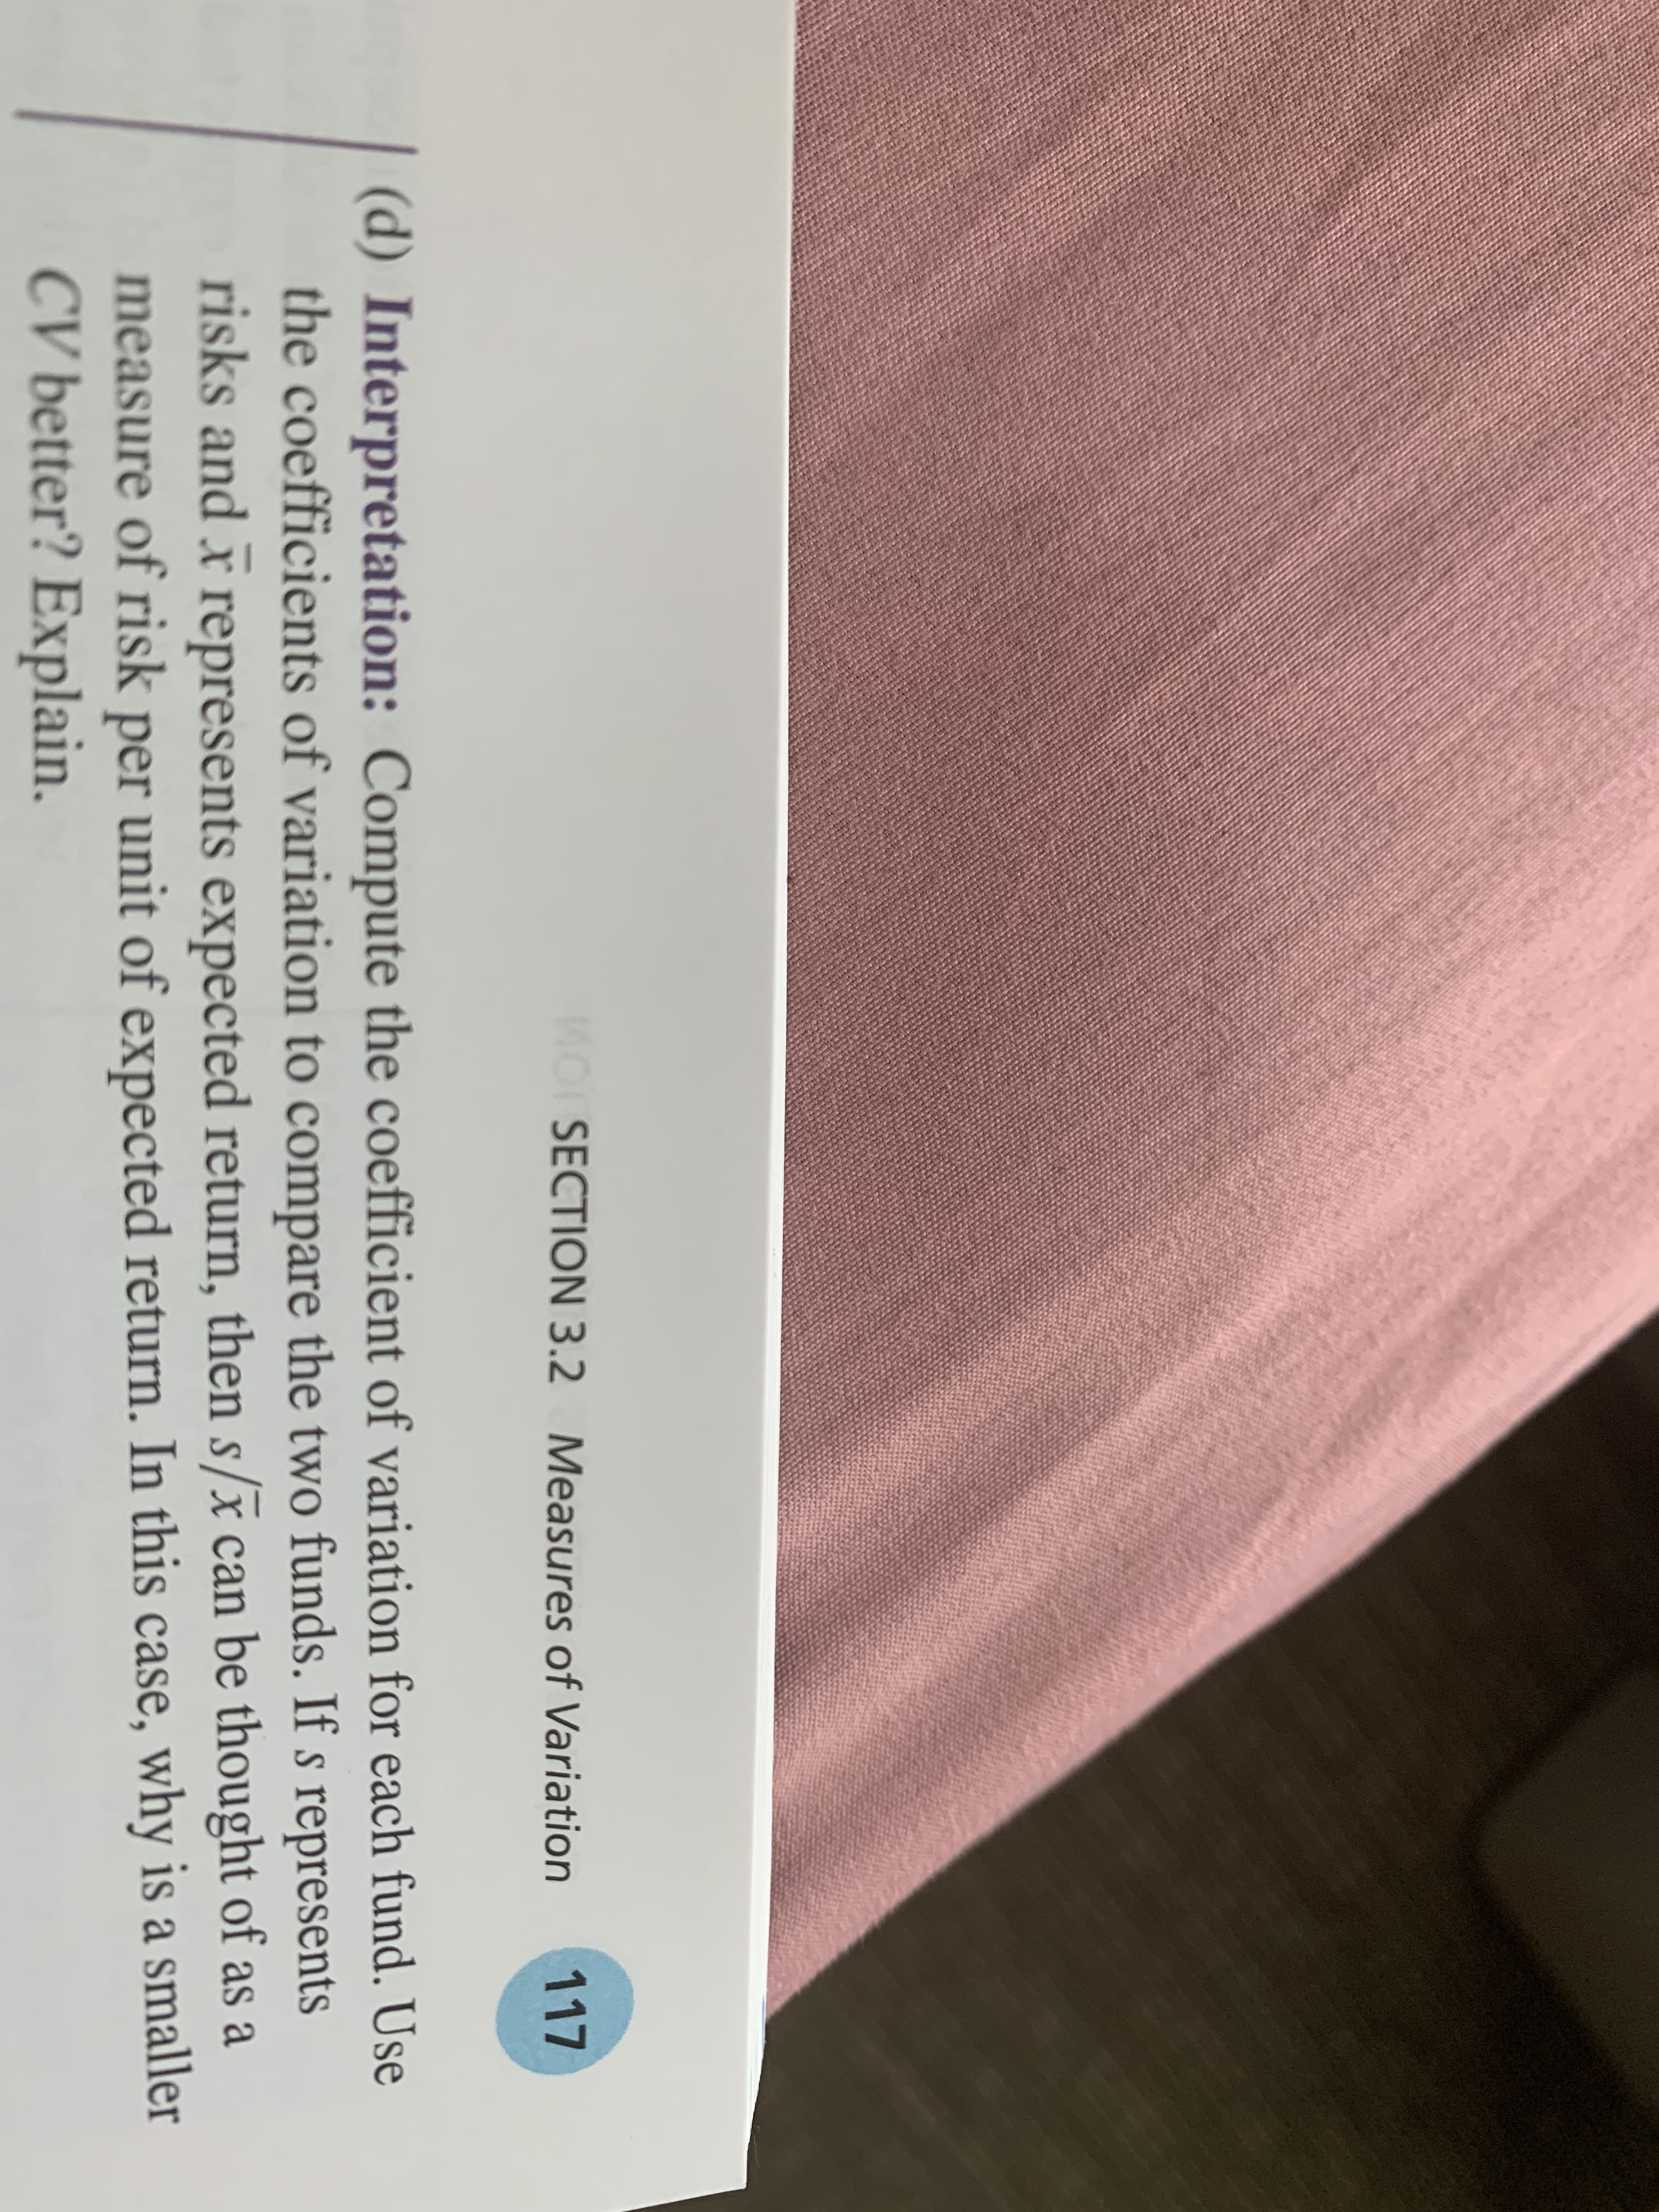
16.| Investing: Stocks and Bonds Do bonds reduce the overall risk of an invest- ment portfolio? Let x be a random variable representing annual percent return for Vanguard Total Stock Index (all stocks). Let y be a random variable representing annual return for Vanguard Balanced Index (60% stock and 40% bond). For the past several years, we have the following data (Reference: Morningstar Research Group, Chicago): 11 O 36 -11 -11 -21 x: 21 31 23 24 y: 10 -2 29 14 22 18 14 -2 -3 -10 (a) Compute Σχ, Σ , Σy, and Σγ. (b) Use the results of part (a) to compute the sample mean, variance, and standard deviation for x and for y. (c) Compute a 75% Chebyshev interval around the mean for x values and also for y values. Use the intervals to compare the two funds. MOSECTION 3.2 Measures of Variation 117 (d) Interpretation: Compute the coefficient of variation for each fund. Use the coefficients of variation to compare the two funds. If s represents risks and x represents expected return, then s/x can be thought of as a measure of risk per unit of expected return. In this case, why is a smaller CV better? Explain.
16.| Investing: Stocks and Bonds Do bonds reduce the overall risk of an invest- ment portfolio? Let x be a random variable representing annual percent return for Vanguard Total Stock Index (all stocks). Let y be a random variable representing annual return for Vanguard Balanced Index (60% stock and 40% bond). For the past several years, we have the following data (Reference: Morningstar Research Group, Chicago): 11 O 36 -11 -11 -21 x: 21 31 23 24 y: 10 -2 29 14 22 18 14 -2 -3 -10 (a) Compute Σχ, Σ , Σy, and Σγ. (b) Use the results of part (a) to compute the sample mean, variance, and standard deviation for x and for y. (c) Compute a 75% Chebyshev interval around the mean for x values and also for y values. Use the intervals to compare the two funds. MOSECTION 3.2 Measures of Variation 117 (d) Interpretation: Compute the coefficient of variation for each fund. Use the coefficients of variation to compare the two funds. If s represents risks and x represents expected return, then s/x can be thought of as a measure of risk per unit of expected return. In this case, why is a smaller CV better? Explain.

Holt Mcdougal Larson Pre-algebra: Student Edition 2012
1st Edition
ISBN:9780547587776
Author:HOLT MCDOUGAL
Publisher:HOLT MCDOUGAL
Chapter11: Data Analysis And Probability
Section: Chapter Questions
Problem 8CR

Related questions
Question
Transcribed Image Text:16.| Investing: Stocks and Bonds Do bonds reduce the overall risk of an invest-
ment portfolio? Let x be a random variable representing annual percent
return for Vanguard Total Stock Index (all stocks). Let y be a random variable
representing annual return for Vanguard Balanced Index (60% stock and 40%
bond). For the past several years, we have the following data (Reference:
Morningstar Research Group, Chicago):
11
O 36
-11
-11 -21
x:
21 31 23
24
y:
10
-2 29
14 22 18
14
-2
-3 -10
(a) Compute Σχ, Σ , Σy, and Σγ.
(b) Use the results of part (a) to compute the sample mean, variance, and
standard deviation for x and for
y.
(c) Compute a 75% Chebyshev interval around the mean for x values and
also for y values. Use the intervals to compare the two funds.
Transcribed Image Text:MOSECTION 3.2 Measures of Variation
117
(d) Interpretation: Compute the coefficient of variation for each fund. Use
the coefficients of variation to compare the two funds. If s represents
risks and x represents expected return, then s/x can be thought of as a
measure of risk per unit of expected return. In this case, why is a smaller
CV better? Explain.
Expert Solution
This question has been solved!
Explore an expertly crafted, step-by-step solution for a thorough understanding of key concepts.

This is a popular solution!

Trending now
This is a popular solution!

Step by step
Solved in 6 steps with 3 images

Recommended textbooks for you
Holt Mcdougal Larson Pre-algebra: Student Edition…
Algebra
ISBN:
9780547587776
Author:
HOLT MCDOUGAL
Publisher:
HOLT MCDOUGAL
Holt Mcdougal Larson Pre-algebra: Student Edition…
Algebra
ISBN:
9780547587776
Author:
HOLT MCDOUGAL
Publisher:
HOLT MCDOUGAL