17. If the absolute value of your calculated t-statistic exceeds the critical value from the standard normal distribution, you can O a. safely assume that your regression results are significant. O b. conclude that most of the actual values are very close to the regression line. Oc reject the assumption that the error terms are homoskedastic. d. reject the null hypothesis.
17. If the absolute value of your calculated t-statistic exceeds the critical value from the standard normal distribution, you can O a. safely assume that your regression results are significant. O b. conclude that most of the actual values are very close to the regression line. Oc reject the assumption that the error terms are homoskedastic. d. reject the null hypothesis.

Managerial Economics: Applications, Strategies and Tactics (MindTap Course List)
14th Edition
ISBN:9781305506381
Author:James R. McGuigan, R. Charles Moyer, Frederick H.deB. Harris
Publisher:James R. McGuigan, R. Charles Moyer, Frederick H.deB. Harris
Chapter4: Estimating Demand
Section: Chapter Questions
Problem 1E

Related questions
Question
Transcribed Image Text:NOMETRICS I
My courses / Faculty OFEconomics & Administrative Sciences / ECON309 / Finals / ECON 309 Final Exam Assignment
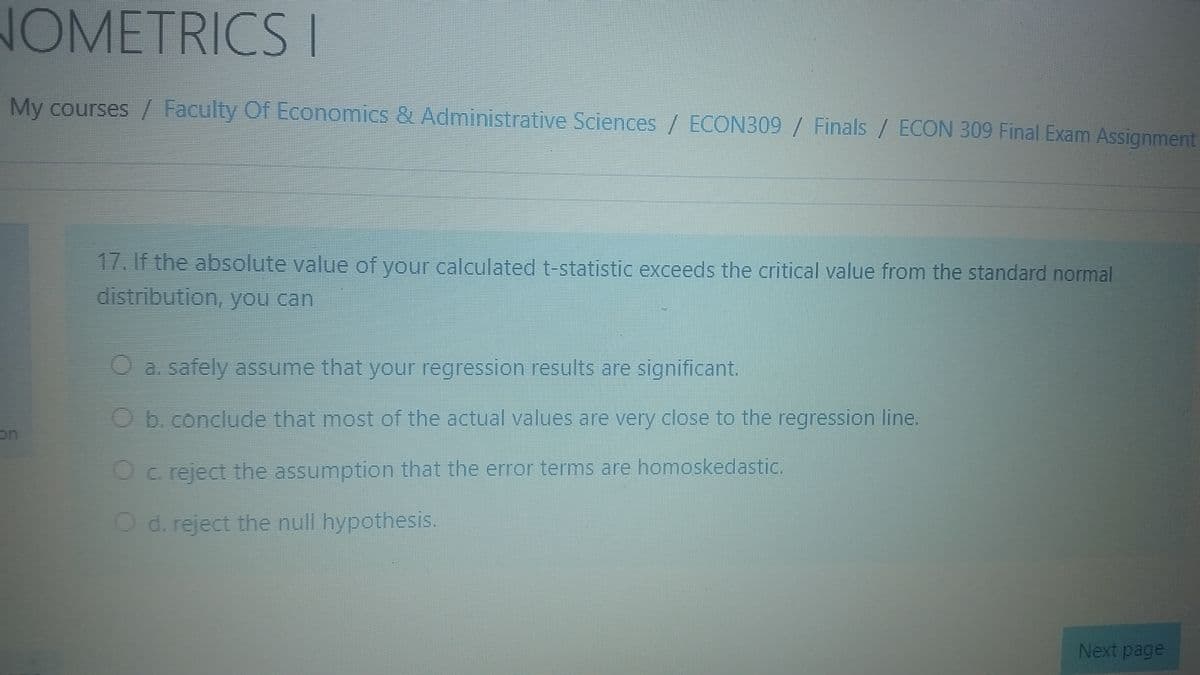
17. If the absolute value of your calculated t-statistic exceeds the critical value from the standard normal
distribution, you can
Oa safely assume that your regression results are significant.
Ob.conclude that most of the actual values are very close to the regression line.
on
O Creject the assumption that the error terms are homoskedastic.
O d. reject the null hypothesis.
Next page
Transcribed Image Text:rd/My courses / Faculty Of Economics & Administrative Sciences / ECON309 / Finals / ECON 309
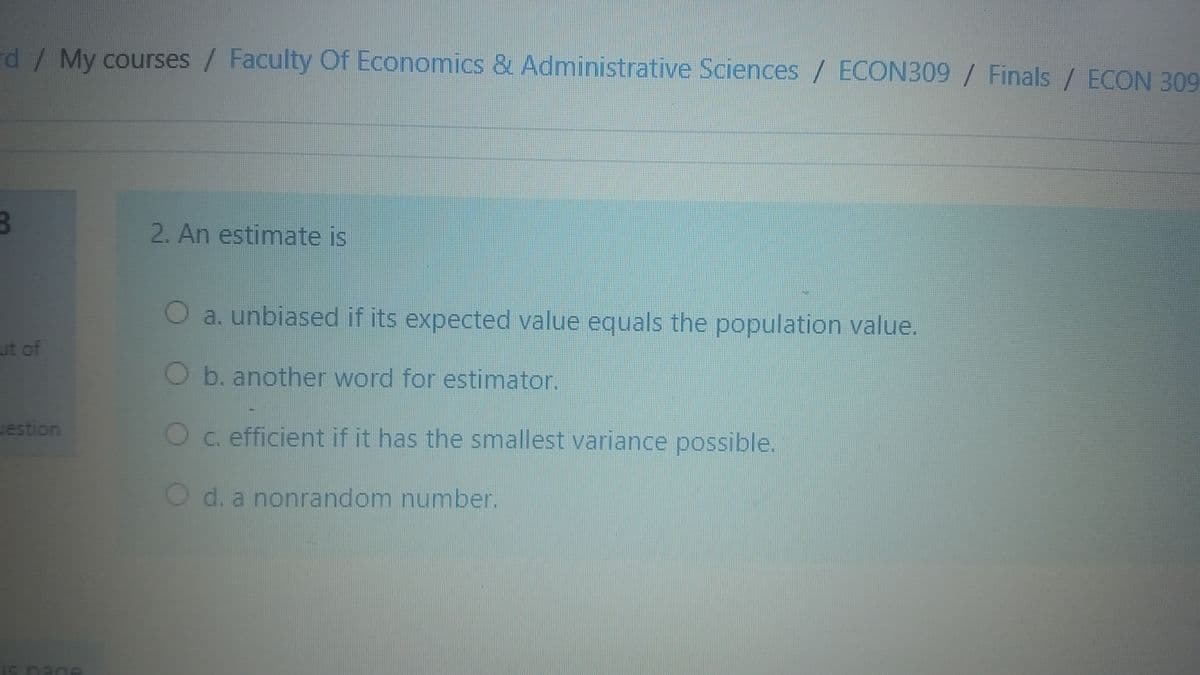
2. An estimate is
O a. unbiased if its expected value equals the population value.
ut of
O b. another word for estimator.
uestion
Oc. efficient if it has the smallest variance possible.
O d. a nonrandom number.
Is nage
Expert Solution
This question has been solved!
Explore an expertly crafted, step-by-step solution for a thorough understanding of key concepts.

This is a popular solution!

Trending now
This is a popular solution!

Step by step
Solved in 2 steps

Knowledge Booster


Learn more about
Need a deep-dive on the concept behind this application? Look no further. Learn more about this topic, economics and related others by exploring similar questions and additional content below.Recommended textbooks for you
Managerial Economics: Applications, Strategies an…
Economics
ISBN:
9781305506381
Author:
James R. McGuigan, R. Charles Moyer, Frederick H.deB. Harris
Publisher:
Cengage Learning
Managerial Economics: Applications, Strategies an…
Economics
ISBN:
9781305506381
Author:
James R. McGuigan, R. Charles Moyer, Frederick H.deB. Harris
Publisher:
Cengage Learning