17,167.5 668.4 1,553.5 973.6 4,413.2 1,007.2 1,797.6 2,633.9 702.0 570.7 2,350.0 497.5 Source: https://www.economics.gov.nl.ca/E2018/TheEconomy2018.pdf a. Use a relative frequency histogram to show the distribu- tion of the estimated GDP for the 12 industries in 2018. b. Identify the class interval that includes the largest and the lowest proportions of the estimated GDP.
17,167.5 668.4 1,553.5 973.6 4,413.2 1,007.2 1,797.6 2,633.9 702.0 570.7 2,350.0 497.5 Source: https://www.economics.gov.nl.ca/E2018/TheEconomy2018.pdf a. Use a relative frequency histogram to show the distribu- tion of the estimated GDP for the 12 industries in 2018. b. Identify the class interval that includes the largest and the lowest proportions of the estimated GDP.

Functions and Change: A Modeling Approach to College Algebra (MindTap Course List)
6th Edition
ISBN:9781337111348
Author:Bruce Crauder, Benny Evans, Alan Noell
Publisher:Bruce Crauder, Benny Evans, Alan Noell
Chapter5: A Survey Of Other Common Functions
Section5.3: Modeling Data With Power Functions
Problem 6E: Urban Travel Times Population of cities and driving times are related, as shown in the accompanying...

Related questions
Question
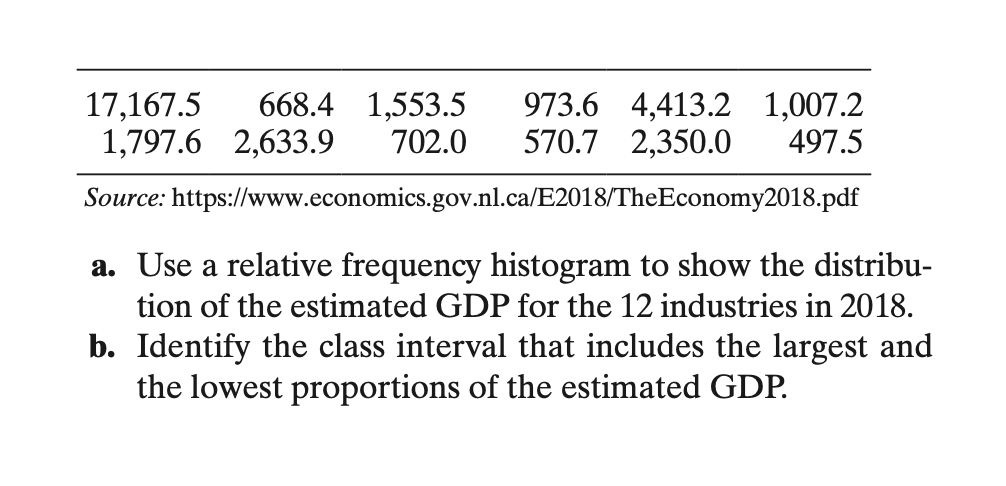
Transcribed Image Text:17,167.5 668.4 1,553.5 973.6 4,413.2 1,007.2
1,797.6 2,633.9 702.0 570.7 2,350.0 497.5
Source: https://www.economics.gov.nl.ca/E2018/TheEconomy2018.pdf
a. Use a relative frequency histogram to show the distribu-
tion of the estimated GDP for the 12 industries in 2018.
b. Identify the class interval that includes the largest and
the lowest proportions of the estimated GDP.
Transcribed Image Text:2.30 Gross domestic product. The Economy is an annual
publication by the Government of Newfoundland and
Labrador (https://www.gov.nl.ca/) on the region's eco-
nomic performance. From data provided by Statistics
Canada Department of Finance, The Economy 2020
reported the estimated Gross Domestic Product (GDP)
(in $ millions) in 2018 for the following 12 indus-
tries: the services producing sector, wholesale trade,
retail trade, transportation and warehousing, finance,
insurance, real estate & business support services, pro-
fessional, scientific, & technical services, educational
services, health care & social assistance, information,
culture & recreation, accommodation & food services,
public administration, and other services. The data is
listed in the accompanying table. In this data, GDP is
expressed at basic prices, measuring payments made to
the owners of factor inputs in production. This differs
from GDP at market prices. The difference is attribut-
able to taxes less subsidies on products and imports.
Industry components may not sum to total due to inde-
pendent rounding.
Expert Solution
This question has been solved!
Explore an expertly crafted, step-by-step solution for a thorough understanding of key concepts.

Step by step
Solved in 4 steps with 9 images

Recommended textbooks for you
Functions and Change: A Modeling Approach to Coll…
Algebra
ISBN:
9781337111348
Author:
Bruce Crauder, Benny Evans, Alan Noell
Publisher:
Cengage Learning
Functions and Change: A Modeling Approach to Coll…
Algebra
ISBN:
9781337111348
Author:
Bruce Crauder, Benny Evans, Alan Noell
Publisher:
Cengage Learning