18. A breeding pair of rabbits escaped from their cage behind a farmer's barn. The farmer observed the rabbits and kept data on their population size for ten years. During this time, the rabbits reproduced and their offspring reproduced many times. The fenced, undisturbed two acres where the rabbits live support populations of predators, such as hawks and snakes, as well as a limited supply of grass and water. At the end of the ten years, the farmer graphed the data he collected. Which of the following graphs would its population growth look like? Don't pick E, you're welcome. A) Time Time Tme ime Popularion sze Populations uogndo
18. A breeding pair of rabbits escaped from their cage behind a farmer's barn. The farmer observed the rabbits and kept data on their population size for ten years. During this time, the rabbits reproduced and their offspring reproduced many times. The fenced, undisturbed two acres where the rabbits live support populations of predators, such as hawks and snakes, as well as a limited supply of grass and water. At the end of the ten years, the farmer graphed the data he collected. Which of the following graphs would its population growth look like? Don't pick E, you're welcome. A) Time Time Tme ime Popularion sze Populations uogndo

Biology 2e
2nd Edition
ISBN:9781947172517
Author:Matthew Douglas, Jung Choi, Mary Ann Clark
Publisher:Matthew Douglas, Jung Choi, Mary Ann Clark
Chapter11: Meiosis And Sexual Reproduction
Section: Chapter Questions
Problem 17RQ: Hydras and jellyfish both live in a freshwater lake that is slowly being acidified by the runoff...

Related questions
Question
Transcribed Image Text:4 of 6
+
80%
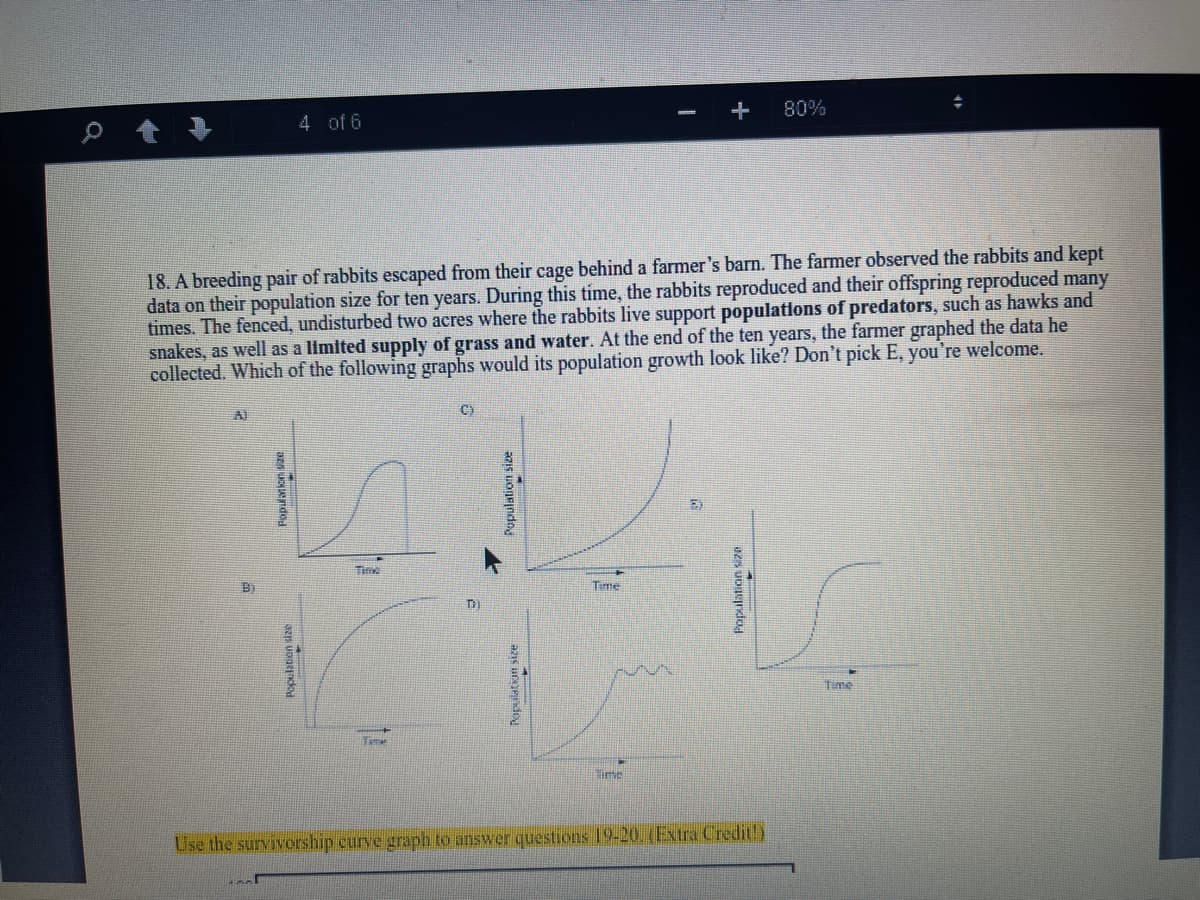
18. A breeding pair of rabbits escaped from their cage behind a farmer's barn. The farmer observed the rabbits and kept
data on their population size for ten years. During this time, the rabbits reproduced and their offspring reproduced many
times. The fenced, undisturbed two acres where the rabbits live support populations of predators, such as hawks and
snakes, as well as a limited supply of grass and water. At the end of the ten years, the farmer graphed the data he
collected. Which of the following graphs would its population growth look like? Don't pick E, you're welcome.
AJ
Time
Time
Time
Time
ime
Use the survivorship curve graph to answer questions 19-20. (Extra Credit!)
urcendo
a2s Uendo
Expert Solution
This question has been solved!
Explore an expertly crafted, step-by-step solution for a thorough understanding of key concepts.

This is a popular solution!

Trending now
This is a popular solution!

Step by step
Solved in 2 steps

Recommended textbooks for you
Biology 2e
Biology
ISBN:
9781947172517
Author:
Matthew Douglas, Jung Choi, Mary Ann Clark
Publisher:
OpenStax
Biology 2e
Biology
ISBN:
9781947172517
Author:
Matthew Douglas, Jung Choi, Mary Ann Clark
Publisher:
OpenStax