4. The carrying capacity of the environment with respect to any population is the maximum number of individuals that can be supported. What do you think are the carrying capacities for these species' populations? Draw horizontal lines on the graph indicating this for each species' population. Adjust your figure legend. 5. Assuming the original 10 organisms grew exponentially, doubling in size with every unit of time, calculate the population size from to to t and draw the position of this curve on your graph. Adjust your figure legend.
4. The carrying capacity of the environment with respect to any population is the maximum number of individuals that can be supported. What do you think are the carrying capacities for these species' populations? Draw horizontal lines on the graph indicating this for each species' population. Adjust your figure legend. 5. Assuming the original 10 organisms grew exponentially, doubling in size with every unit of time, calculate the population size from to to t and draw the position of this curve on your graph. Adjust your figure legend.

Biology (MindTap Course List)
11th Edition
ISBN:9781337392938
Author:Eldra Solomon, Charles Martin, Diana W. Martin, Linda R. Berg
Publisher:Eldra Solomon, Charles Martin, Diana W. Martin, Linda R. Berg
Chapter54: Community Ecology
Section: Chapter Questions
Problem 17TYU: INTERPRET DATA Examine the top and middle graphs in Figure 54-5. Are these examples of exponential...

Related questions
Question
please answer at least question 4 or 5 rather than answering none.
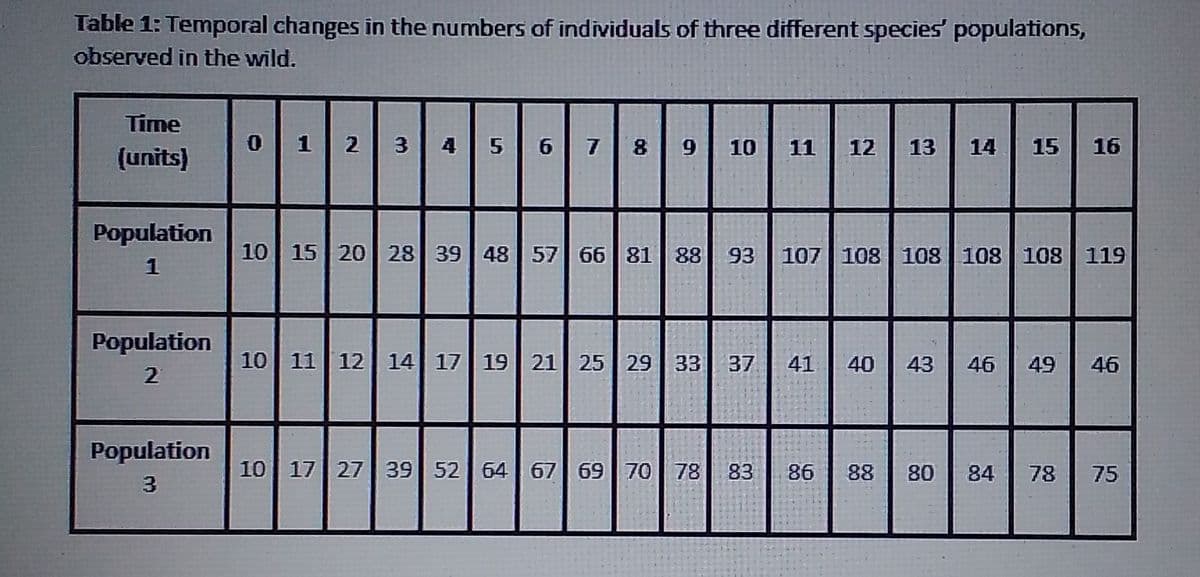
Transcribed Image Text:Table 1: Temporal changes in the numbers of individuals of three different species' populations,
observed in the wild.
Time
(units)
1
2
3
4 56 7 8
10
11
12
13
14
15
16
Population
10| 15 20| 28 39 48 57 66 81 88
93
107 108 108 108 108 119
1
Population
10 11 12 14 17 19 21 25 29 33
37
41
40
43
46
49
46
2
Population
10| 17 27 39 52 | 64 67 69 70 78 83
86
88
80
78
75
84
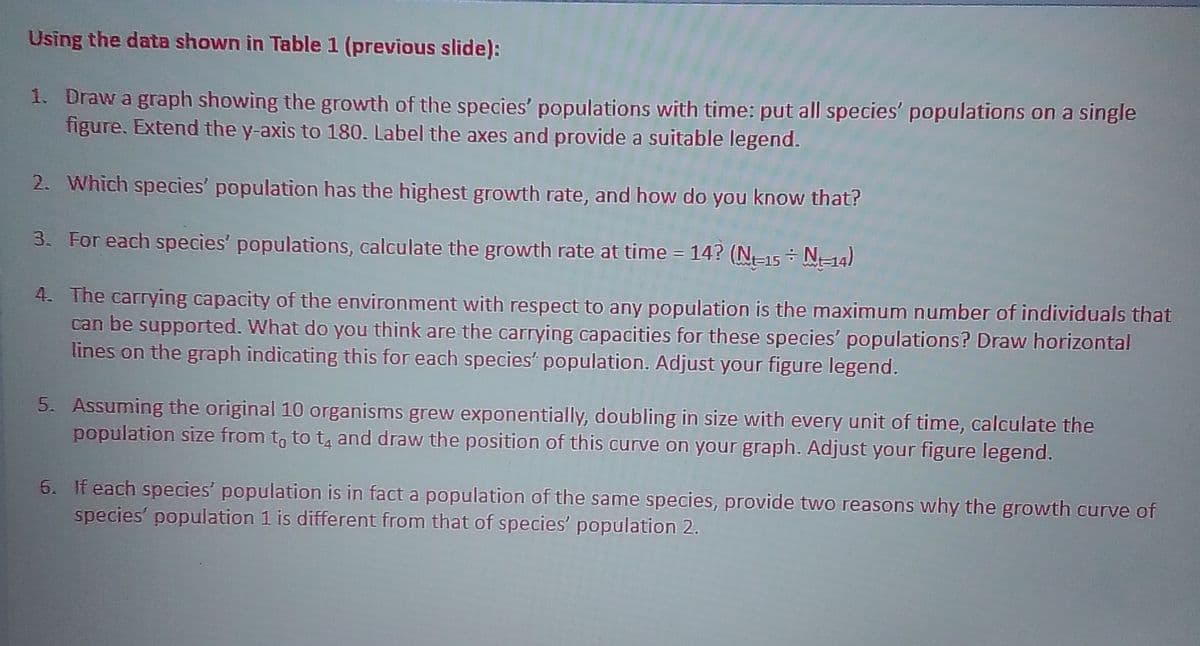
Transcribed Image Text:Using the data shown in Table 1 (previous slide):
1. Draw a graph showing the growth of the species' populations with time: put all species' populations on a single
figure. Extend the y-axis to 180. Label the axes and provide a suitable legend.
2. Which species' population has the highest growth rate, and how do you know that?
3. For each species' populations, calculate the growth rate at time = 14? (N15 - N-14)
4. The carrying capacity of the environment with respect to any population is the maximum number of individuals that
can be supported. What do you think are the carrying capacities for these species' populations? Draw horizontal
lines on the graph indicating this for each species' population. Adjust your figure legend.
5. Assuming the original 10 organisms grew exponentially, doubling in size with every unit of time, calculate the
population size from t, to t, and draw the position of this curve on your graph. Adjust your figure legend.
5. If each species' population is in fact a population of the same species, provide two reasons why the growth curve of
species' population 1 is different from that of species' population 2.
Expert Solution
This question has been solved!
Explore an expertly crafted, step-by-step solution for a thorough understanding of key concepts.

Step by step
Solved in 2 steps with 2 images

Recommended textbooks for you
Biology (MindTap Course List)
Biology
ISBN:
9781337392938
Author:
Eldra Solomon, Charles Martin, Diana W. Martin, Linda R. Berg
Publisher:
Cengage Learning
Biology (MindTap Course List)
Biology
ISBN:
9781337392938
Author:
Eldra Solomon, Charles Martin, Diana W. Martin, Linda R. Berg
Publisher:
Cengage Learning