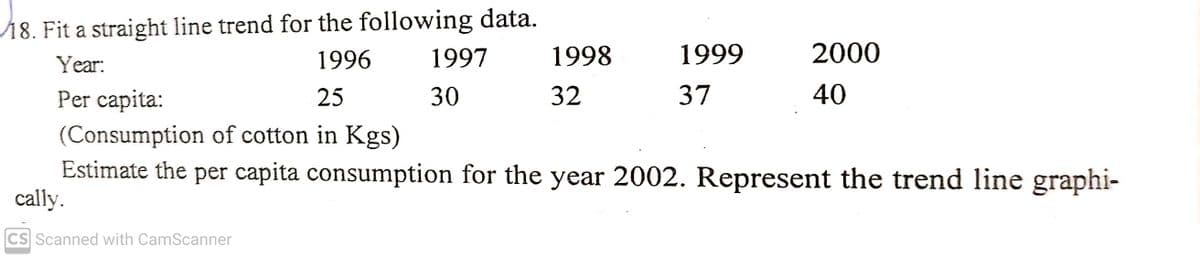
18. Fit a straight line trend for the following data. 1997 1996 1998 1999 2000 Year: Per capita: 25 30 32 37 40 (Consumption of cotton in Kgs) Estimate the per capita consumption for the year 2002. Represent the trend line graphi- cally.
18. Fit a straight line trend for the following data. 1997 1996 1998 1999 2000 Year: Per capita: 25 30 32 37 40 (Consumption of cotton in Kgs) Estimate the per capita consumption for the year 2002. Represent the trend line graphi- cally.

Glencoe Algebra 1, Student Edition, 9780079039897, 0079039898, 2018
18th Edition
ISBN:9780079039897
Author:Carter
Publisher:Carter
Chapter4: Equations Of Linear Functions
Section4.5: Correlation And Causation
Problem 11PPS

Related questions
Question
100%
Transcribed Image Text:18. Fit a straight line trend for the following data.
1997
1996
1998
1999
2000
Year:
Per capita:
25
30
32
37
40
(Consumption of cotton in Kgs)
Estimate the per capita consumption for the year 2002. Represent the trend line graphi-
cally.
CS Scanned with CamScanner
Expert Solution
This question has been solved!
Explore an expertly crafted, step-by-step solution for a thorough understanding of key concepts.

Step by step
Solved in 3 steps with 3 images

Recommended textbooks for you
Glencoe Algebra 1, Student Edition, 9780079039897…
Algebra
ISBN:
9780079039897
Author:
Carter
Publisher:
McGraw Hill


Holt Mcdougal Larson Pre-algebra: Student Edition…
Algebra
ISBN:
9780547587776
Author:
HOLT MCDOUGAL
Publisher:
HOLT MCDOUGAL
Glencoe Algebra 1, Student Edition, 9780079039897…
Algebra
ISBN:
9780079039897
Author:
Carter
Publisher:
McGraw Hill
Holt Mcdougal Larson Pre-algebra: Student Edition…
Algebra
ISBN:
9780547587776
Author:
HOLT MCDOUGAL
Publisher:
HOLT MCDOUGAL