18.22 Food counseling According to the Centers for Disease Control and Prevention (CDC), obesity rates among U.S. children have increased dramatically over the past three decades, from a low of about 5% to 18% as of 2010. A study examined the effect of family-based food-counseling sessions provided by trained professionals. The study randomly assigned obese children aged 9 to 12 years to either the counseling intervention or a control group not receiving any food counseling. The children's weight changes (in pounds, Ib) after 15 weeks are displayed in Table 18.3 for both conditions. 18 (a) Plot both data sets using dotplots or histograms. Because the sample sizes are quite large, the t procedures folkous or mild
18.22 Food counseling According to the Centers for Disease Control and Prevention (CDC), obesity rates among U.S. children have increased dramatically over the past three decades, from a low of about 5% to 18% as of 2010. A study examined the effect of family-based food-counseling sessions provided by trained professionals. The study randomly assigned obese children aged 9 to 12 years to either the counseling intervention or a control group not receiving any food counseling. The children's weight changes (in pounds, Ib) after 15 weeks are displayed in Table 18.3 for both conditions. 18 (a) Plot both data sets using dotplots or histograms. Because the sample sizes are quite large, the t procedures folkous or mild

College Algebra (MindTap Course List)
12th Edition
ISBN:9781305652231
Author:R. David Gustafson, Jeff Hughes
Publisher:R. David Gustafson, Jeff Hughes
Chapter8: Sequences, Series, And Probability
Section8.7: Probability
Problem 58E: What is meant by the sample space of an experiment?

Related questions
Question
18.22 please
Transcribed Image Text:COMPARING TWO MEANS
124 126 116 127 119 97 102 110 120 103 115
111 107 100 107 115 111 97 112 104 106 113
109 113 128 128 118 113 124 127 136 106 123
466
CHAPTER EIGHTEEN
(a) Treat these data as SRSS from the population of adult
long-tailed finches in the wild. Make dotplots of both data
sets and determine whether the use of a two-sample t
procedure is appropriate.
test scores of 31 seventh-grade girls in a midwestern sch
district:19
114 100 104 89 102 91 114 114 103 105
72
(b) How much longer, on average, are the central tail
feathers of male long-tailed finches than those of the
females? Give a 95% confidence interval for the difference
in population mean length between the male and the
female adult long-tailed finches.
108 130 120 132 111 128 118 119 86
111 103 74 112 107 103 98 96 112 112 0.
The IQ test scores of 47 seventh-grade boys in the same
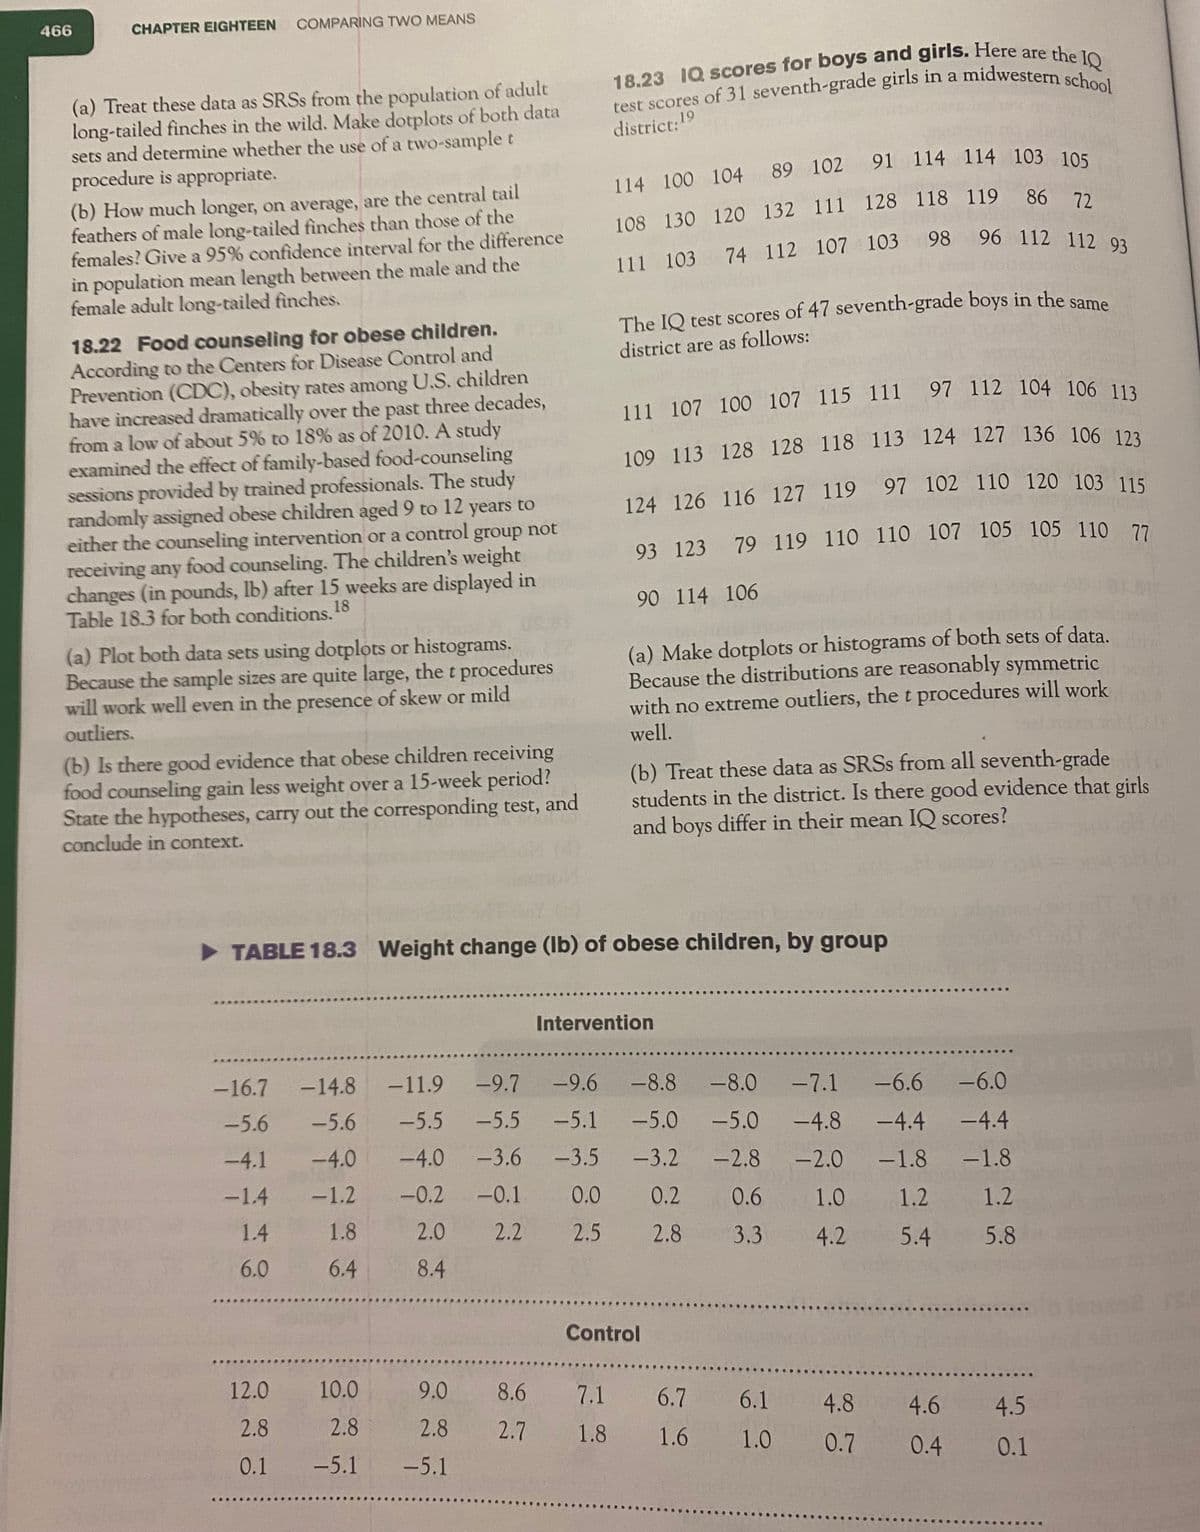
18.22 Food counseling for obese children.
According to the Centers for Disease Control and
Prevention (CDC), obesity rates among U.S. children
have increased dramatically over the past three decades,
from a low of about 5% to 18% as of 2010. A study
examined the effect of family-based food-counseling
sessions provided by trained professionals. The study
randomly assigned obese children aged 9 to 12 years to
either the counseling intervention or a control group not
receiving any food counseling. The children's weight
changes (in pounds, lb) after 15 weeks are displayed in
Table 18.3 for both conditions. 18
district are as follows:
93 123 79 119 110 110 107 105 105 110 77
90 114 106
(a) Plot both data sets using dotplots or histograms.
Because the sample sizes are quite large, the t procedures
will work well even in the presence of skew or mild
outliers.
(a) Make dotplots or histograms of both sets of data.
Because the distributions are reasonably symmetric
with no extreme outliers, the t procedures will work
well.
(b) Is there good evidence that obese children receiving
food counseling gain less weight over a 15-week period?
State the hypotheses, carry out the corresponding test, and
conclude in context.
(b) Treat these data as SRSS from all seventh-grade
students in the district. Is there good evidence that girls
and boys differ in their mean IQ scores?
> TABLE 18.3 Weight change (Ib) of obese children, by group
Intervention
-16.7
-14.8
-11.9
-9.7
-9.6
-8.8
-8.0
-7.1
-6.6
-6.0
-5.6
-5.6
-5.5
-5.5
-5.1
-5.0
-5.0
-4.8
-4.4
-4.4
-4.1
-4.0
-4.0
-3.6
-3.5
-3.2 -2.8
-2.0
-1.8
-1.8
-1.4
-1.2
-0.2
-0.1
0.0
0.2
0.6
1.0
1.2
1.2
1.4
1.8
2.0
2.2
2.5
2.8
3.3
4.2
5.4
5.8
6.0
6.4
8.4
Control
12.0
10.0
9.0
8.6
7.1
6.7
6.1
4.8
4.6
4.5
2.8
2.8
2.8
2.7
1.8
1.6 1.0
0.7
0.4
0.1
0.1
-5.1
-5.1
Expert Solution
This question has been solved!
Explore an expertly crafted, step-by-step solution for a thorough understanding of key concepts.

This is a popular solution!

Trending now
This is a popular solution!

Step by step
Solved in 6 steps with 2 images

Recommended textbooks for you
College Algebra (MindTap Course List)
Algebra
ISBN:
9781305652231
Author:
R. David Gustafson, Jeff Hughes
Publisher:
Cengage Learning
College Algebra (MindTap Course List)
Algebra
ISBN:
9781305652231
Author:
R. David Gustafson, Jeff Hughes
Publisher:
Cengage Learning