180 160 140 120 100 80 riator stress q (kPa)

Principles of Geotechnical Engineering (MindTap Course List)
9th Edition
ISBN:9781305970939
Author:Braja M. Das, Khaled Sobhan
Publisher:Braja M. Das, Khaled Sobhan
Chapter17: Subsoil Exploration
Section: Chapter Questions
Problem 17.2P

Related questions

Question
Please answer the questionoa and show all work
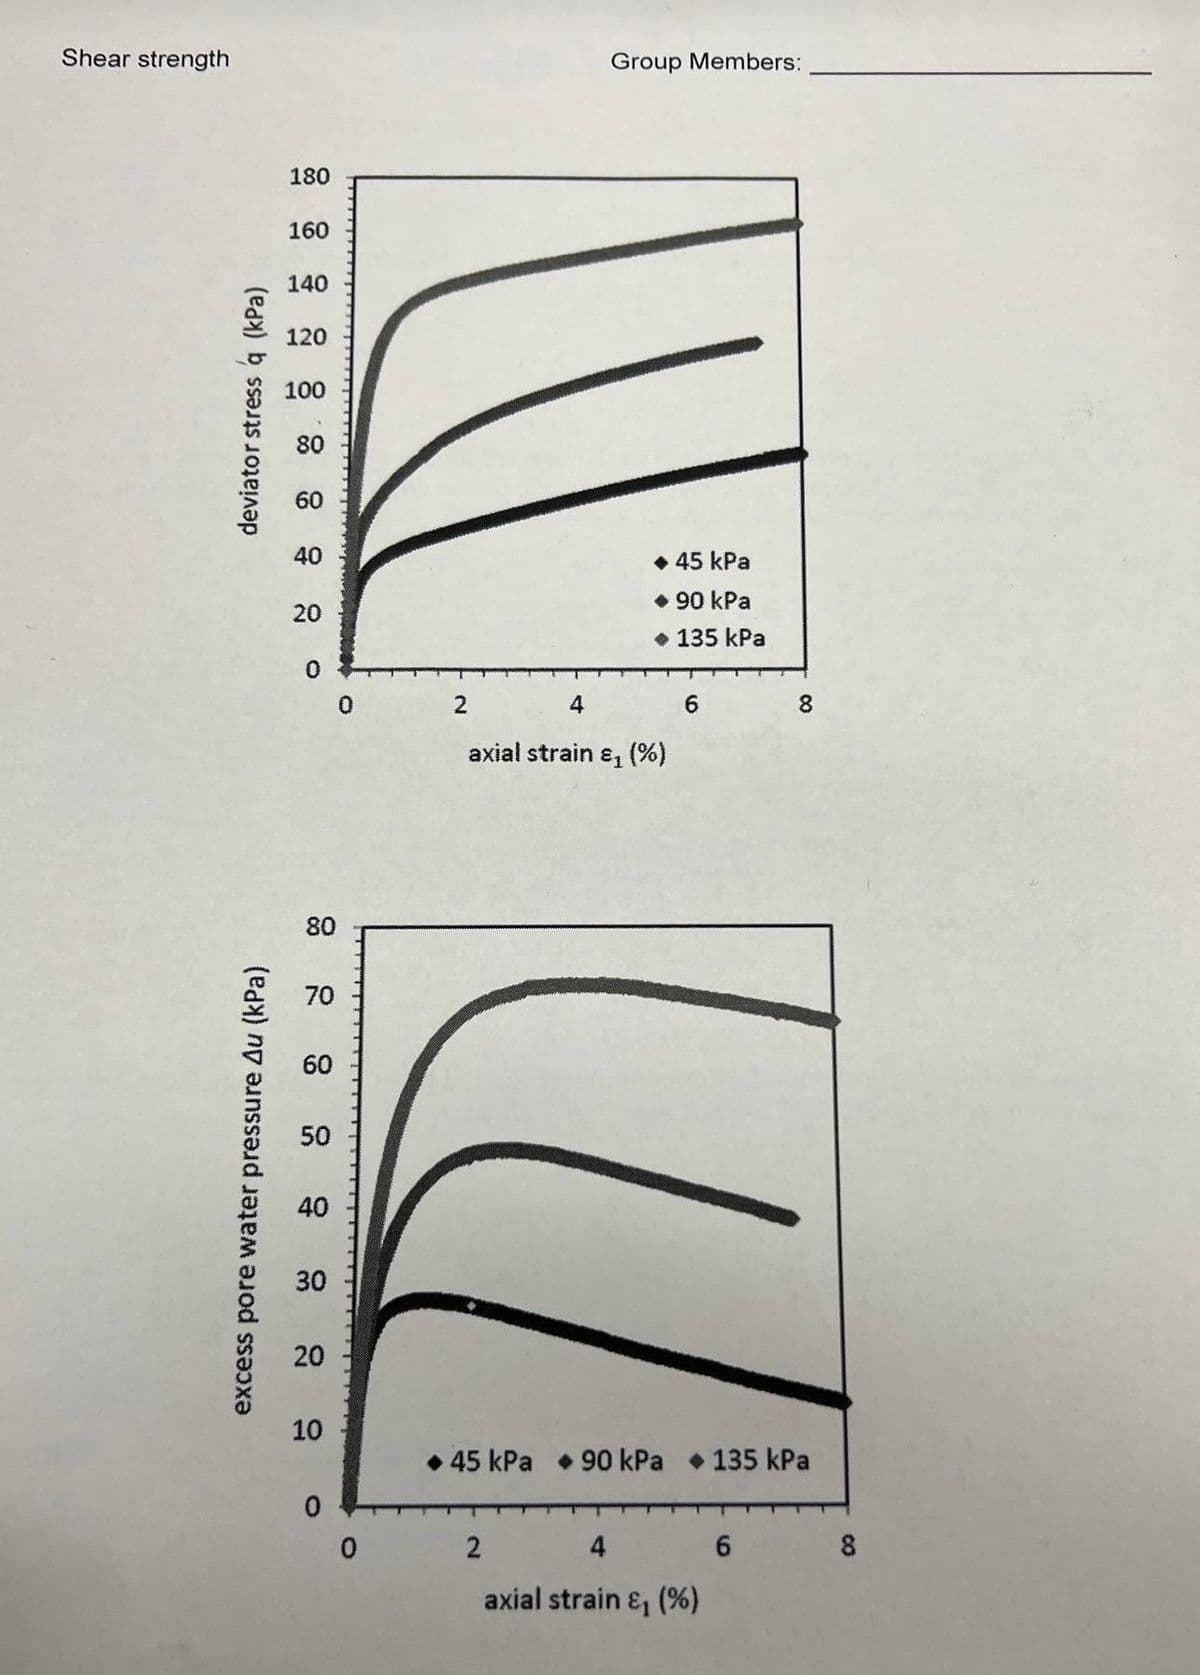
Transcribed Image Text:Shear strength
Group Members:
180
160
140
120
100
80
60
40
• 45 kPa
• 90 kPa
20
• 135 kPa
2
4
6.
8
axial strain ɛ, ()
80
70
60
50
40
30
20
10
• 45 kPa • 90 kPa • 135 kPa
0.
2
4
8.
axial strain &, (%)
deviator stress q (kPa)
excess pore water pressure Au (kPa)
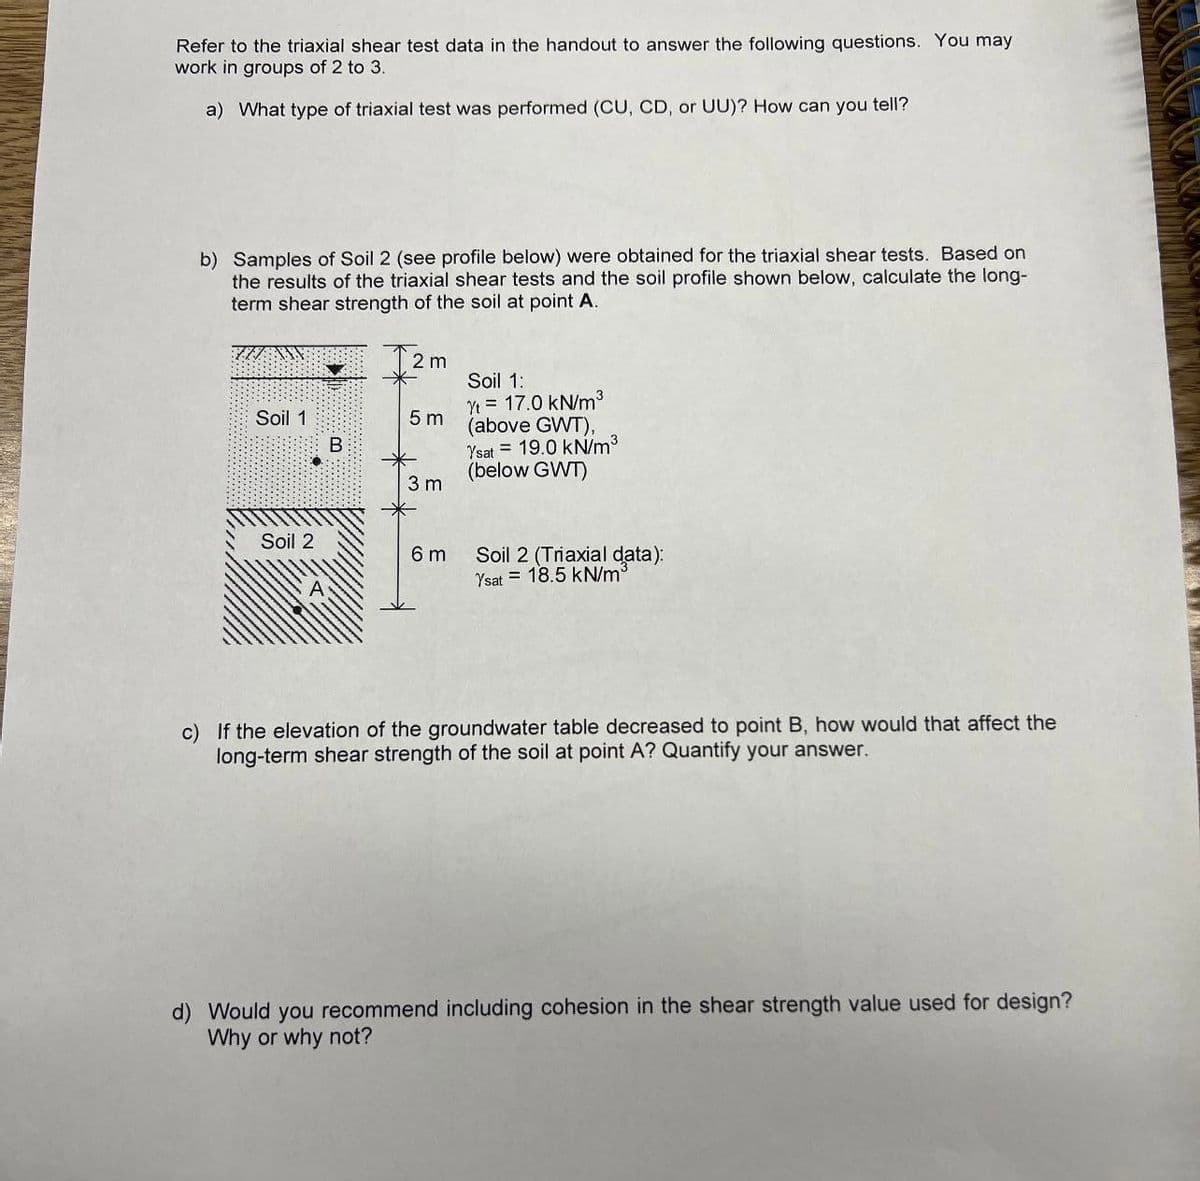
Transcribed Image Text:Refer to the triaxial shear test data in the handout to answer the following questions. You may
work in groups of 2 to 3.
a) What type of triaxial test was performed (CU, CD, or UU)? How can you tell?
b) Samples of Soil 2 (see profile below) were obtained for the triaxial shear tests. Based on
the results of the triaxial shear tests and the soil profile shown below, calculate the long-
term shear strength of the soil at point A.
2 m
Soil 1:
Yt = 17.0 kN/m3
5 m
(above GWT),
Soil 1
Ysat = 19.0 kN/m3
(below GWT)
3 m
Soil 2
6 m
Soil 2 (Triaxial data):
Ysat = 18.5 kN/m3
c) If the elevation of the groundwater table decreased to point B, how would that affect the
long-term shear strength of the soil at point A? Quantify your answer.
d) Would you recommend including cohesion in the shear strength value used for design?
Why or why not?
Expert Solution
This question has been solved!
Explore an expertly crafted, step-by-step solution for a thorough understanding of key concepts.

This is a popular solution!

Trending now
This is a popular solution!

Step by step
Solved in 5 steps with 5 images

Knowledge Booster


Learn more about
Need a deep-dive on the concept behind this application? Look no further. Learn more about this topic, civil-engineering and related others by exploring similar questions and additional content below.Recommended textbooks for you
Principles of Geotechnical Engineering (MindTap C…
Civil Engineering
ISBN:
9781305970939
Author:
Braja M. Das, Khaled Sobhan
Publisher:
Cengage Learning
Principles of Geotechnical Engineering (MindTap C…
Civil Engineering
ISBN:
9781305970939
Author:
Braja M. Das, Khaled Sobhan
Publisher:
Cengage Learning