19> The Weschler Intelligence Scale for Children (WISC) is an intelligence test designed for children between the ages of 6 and 16. The test is standardized so that the mean score for all children is 100 and the standard deviation is 15. Suppose that the administrators of a very large and competitive school district wish to estimate the mean WISC score for all students enrolled in their programs for gifted and talented children. They obtained a random sample of 40 students currently enrolled in at 1least one program for gifted and talented children. The test scores for this sample are as follows: 117, 142, 112,99, 107, 109, 109, 121, 121, 125, 116, 123, 110, 105, 110, 111,95, 128, 103, 106, 155,98, 100, 123, 107, 137, 115, 127, 102, 106, 121, 113, 109, 128, 103, 105, 130, 134, 112, 102 Click to download the data in your preferred format. CrunchIt! CSV Excel JMP Mac Text Minitab PC Text R SPSS TI Calc Use this data to calculate the mean WISC score, x, for these 40 students. Next, compute the standard deviation, SD, of the sampling distribution of the sample mean, assuming that the standard deviation of WISC scores for students in the district is the same as for the population as a whole. Finally, determine both the lower and upper limits of a 99% z-confidence interval for u, the mean score for all students in the school district who are enrolled in gifted and talented programs. about us privacy policy terms of use careers contact us help ENG f 19 > Click to download the data in your preferred format. CrunchIt! CSV Excel JMP Mac Text Minitab PC Text R SPSS TI Calc Use this data to calculate the mean WISC score, x, for these 40 students. Next, compute the standard deviation, SD, of the sampling distribution of the sample mean, assuming that the standard deviation of WISC scores for students in the district is the same as for the population as a whole. Finally, determine both the lower and upper limits of a 99% z-confidence interval for u, the mean score for all students in the school district who are enrolled in gifted and talented programs. Give x and the limits of the confidence interval precise to one decimal place, but give the standard deviation to at least three decimal places in order avoid rounding errors when computing the limits. SD = Lower limit Upper limit = about us privacy policy terms of use contact us help careers ENG


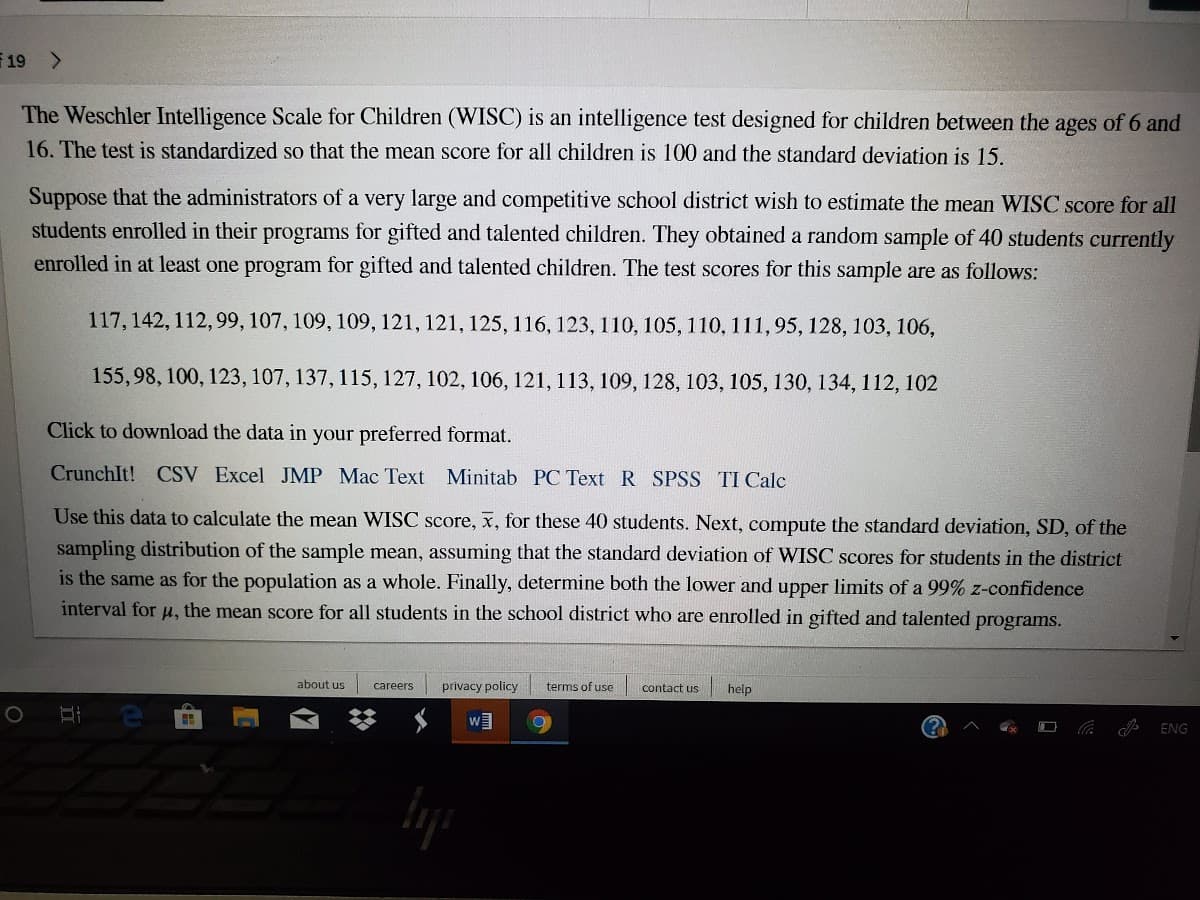
The Weschler Intelligence Scale for Children (WISC) is an intelligence test designed for children between the ages of 6 and 16. The test is standardized so that the mean score for all children is 100 and the standard deviation is 15.
Suppose that the administrators of a very large and competitive school district wish to estimate the mean WISC score for all students enrolled in their programs for gifted and talented children. They obtained a random sample of 40 students currently enrolled in at least one program for gifted and talented children. The test scores for this sample are as follows:
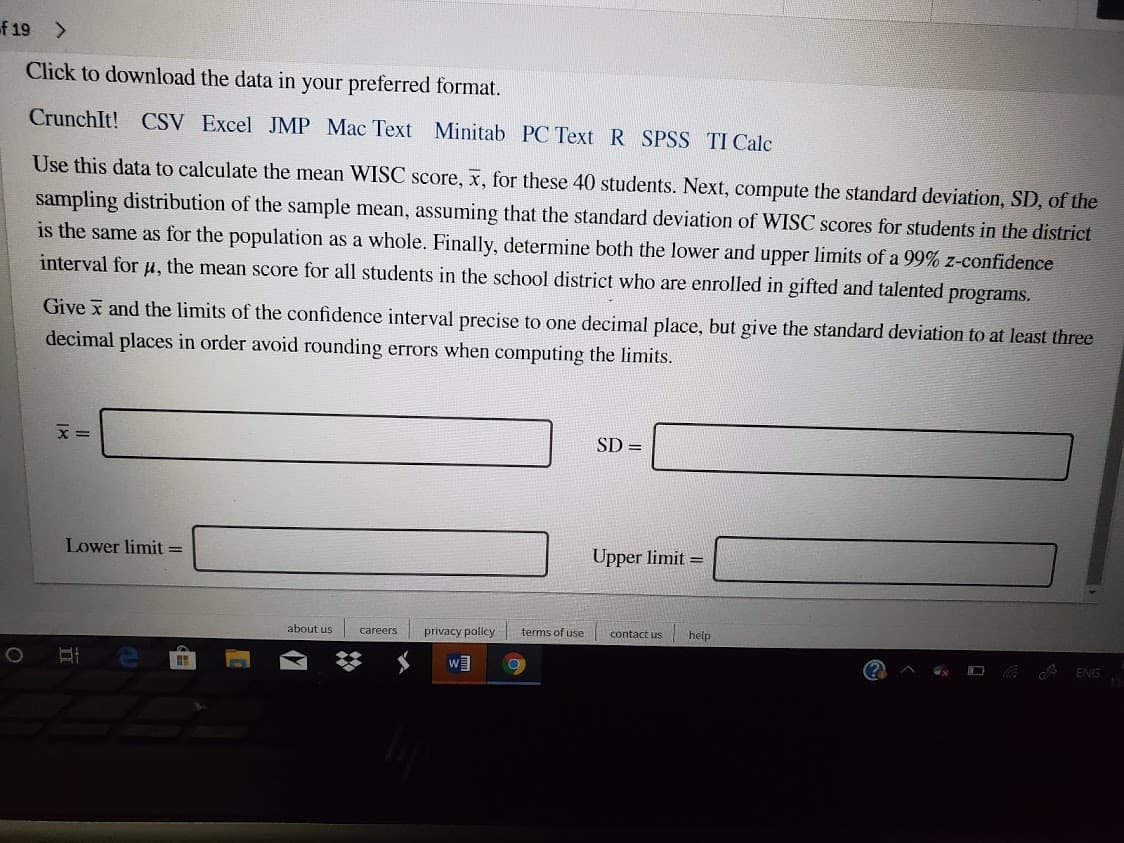
Click to download the data in your preferred format.
CrunchIt! CSV Excel JMP Mac Text Minitab PC Text R SPSS TI Calc
Use this data to calculate the mean WISC score, x¯, for these 40 students. Next, compute the standard deviation, SD, of the sampling distribution of the sample mean, assuming that the standard deviation of WISC scores for students in the district is the same as for the population as a whole. Finally, determine both the lower and upper limits of a 99% z-confidence interval for μ, the mean score for all students in the school district who are enrolled in gifted and talented programs.
Give x¯ and the limits of the confidence interval precise to one decimal place, but give the standard deviation to at least three decimal places in order avoid rounding errors when computing the limits.


Trending now
This is a popular solution!

Step by step
Solved in 4 steps with 3 images


