Listed in the data table are IQ scores for a random sample of subjects with medium lead levels in their blood. Also listed are statistics from a study done of IQ scores for a random sample of subjects with high samples are independent simple random samples selected from normally distributed populations. Do not assume that the population standard deviations are equal. Complete parts (a) and (b) below. E Click the icon to view the data table of IQ scores. nanndod.nunnan nnn ninn mnnfone in cenann nnndad nn unemnnen nndlunann n nn un n nan ... OA Ho: H12 H: H > 2 OB. Ho: H1 =H2 H: H 2 D. Ho: H1"H2 H: H1 > H2 c. Họ: H1 SH2 The test statistic is 0.41. (Round to two decimal places as needed.) The P-value is 0.343. (Round to three decimal places as needed.) State the conclusion for the test. O A. Reject the null hypothesis. There is sufficient evidence to support the claim that subjects with medium lead levels have higher IQ scores. O B. Fail to reject the null hypothesis. There is sufficient evidence to support the claim that subjects with medium lead levels have higher IQ scores. C. Fail to reject the null hypothesis. There is not sufficient evidence to support the claim that subjects with medium lead levels have higher IQ scores. O D. Reject the null hypothesis. There is not sufficient evidence to support the claim that subjects with medium lead levels have higher IQ scores. b. Construct a confidence interval suitable for testing the claim that the mean IQ scores for subjects with medium lead levels is higher than the mean for subjects with high lead levels.
Listed in the data table are IQ scores for a random sample of subjects with medium lead levels in their blood. Also listed are statistics from a study done of IQ scores for a random sample of subjects with high samples are independent simple random samples selected from normally distributed populations. Do not assume that the population standard deviations are equal. Complete parts (a) and (b) below. E Click the icon to view the data table of IQ scores. nanndod.nunnan nnn ninn mnnfone in cenann nnndad nn unemnnen nndlunann n nn un n nan ... OA Ho: H12 H: H > 2 OB. Ho: H1 =H2 H: H 2 D. Ho: H1"H2 H: H1 > H2 c. Họ: H1 SH2 The test statistic is 0.41. (Round to two decimal places as needed.) The P-value is 0.343. (Round to three decimal places as needed.) State the conclusion for the test. O A. Reject the null hypothesis. There is sufficient evidence to support the claim that subjects with medium lead levels have higher IQ scores. O B. Fail to reject the null hypothesis. There is sufficient evidence to support the claim that subjects with medium lead levels have higher IQ scores. C. Fail to reject the null hypothesis. There is not sufficient evidence to support the claim that subjects with medium lead levels have higher IQ scores. O D. Reject the null hypothesis. There is not sufficient evidence to support the claim that subjects with medium lead levels have higher IQ scores. b. Construct a confidence interval suitable for testing the claim that the mean IQ scores for subjects with medium lead levels is higher than the mean for subjects with high lead levels.

Glencoe Algebra 1, Student Edition, 9780079039897, 0079039898, 2018
18th Edition
ISBN:9780079039897
Author:Carter
Publisher:Carter
Chapter10: Statistics
Section10.4: Distributions Of Data
Problem 22PFA

Related questions
Question
I need b thankyou
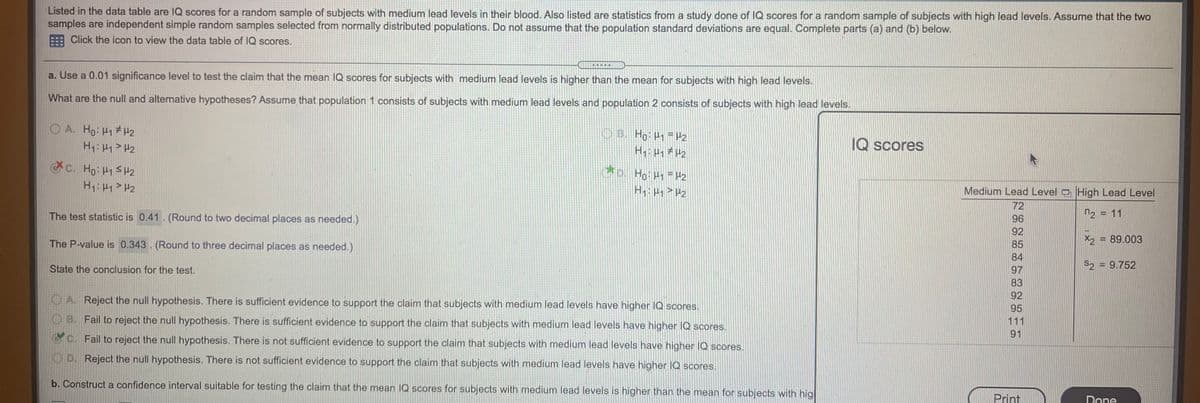
Transcribed Image Text:Listed in the data table are IQ scores for a random sample of subjects with medium lead levels in their blood. Also listed are statistics from a study done of IQ scores for a random sample of subjects with high lead levels. Assume that the two
samples are independent simple random samples selected from normally distributed populations. Do not assume that the population standard deviations are equal. Complete parts (a) and (b) below.
Click the icon to view the data table of IQ scores.
a. Use a 0.01 significance level to test the claim that the mean IQ scores for subjects with medium lead levels is higher than the mean for subjects with high lead levels.
What are the null and alternative hypotheses? Assume that population 1 consists of subjects with medium lead levels and population 2 consists of subjects with high lead levels.
OA Ho H1#H2
OB Ho: H1= H2
H1: H1> H2
IQ scores
C. Ho: P1 SH2
GD. Ho: H1- H2
Medium Lead Level High Lead Level
The test statistic is 0.41. (Round to two decimal places as needed.)
72
96
n2 = 11
92
The P-value is 0.343. (Round to three decimal places as needed.)
X2 = 89.003
85
84
State the conclusion for the test.
97
S2 = 9.752
83
92
O A. Reject the null hypothesis. There is sufficient evidence to support the claim that subjects with medium lead levels have higher IQ scores.
95
OB. Fail to reject the null hypothesis. There is sufficient evidence to support the claim that subjects with medium lead levels have higher IQ scores.
111
91
OC. Fail to reject the null hypothesis. There is not sufficient evidence to support the claim that subjects with medium lead levels have higher IQ scores.
O D. Reject the null hypothesis. There is not sufficient evidence to support the claim that subjects with medium lead levels have higher IQ scores.
b. Construct a confidence interval suitable for testing the claim that the mean IQ scores for subjects with medium lead levels is higher than the mean for subjects with hig
Print
Done
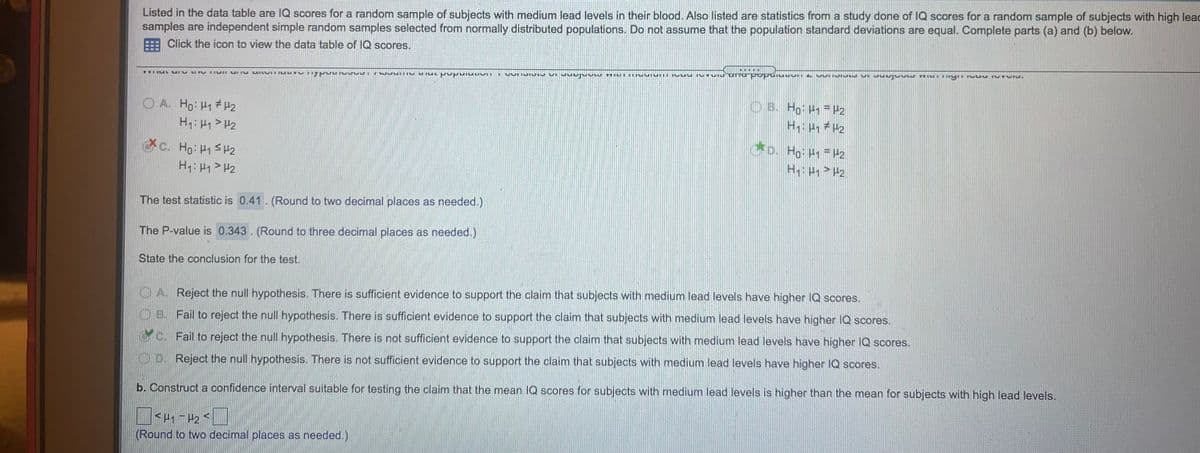
Transcribed Image Text:Listed in the data table are IQ scores for a random sample of subjects with medium lead levels in their blood. Also listed are statistics from a study done of IQ scores for a random sample of subjects with high leac
samples are independent simple random samples selected from normally distributed populations. Do not assume that the population standard deviations are equal. Complete parts (a) and (b) below.
Click the icon to view the data table of lQ scores.
O B. Ho H H2
O A. Ho: H1 #H2
H: H1> H2
o. Ho: H P2
c. Ho: H1 SH2
H1: H1> H2
The test statistic is 0.41. (Round to two decimal places as needed.)
The P-value is 0.343. (Round to three decimal places as needed.)
State the conclusion for the test.
O A. Reject the null hypothesis. There is sufficient evidence to support the claim that subjects with medium lead levels have higher IQ scores.
OB. Fail to reject the null hypothesis. There is sufficient evidence to support the claim that subjects with medium lead levels have higher IQ scores.
G c. Fail to reject the null hypothesis. There is not sufficient evidence to support the claim that subjects with medium lead levels have higher IQ scores.
O D. Reject the null hypothesis. There is not sufficient evidence to support the claim that subjects with medium lead levels have higher IQ scores.
b. Construct a confidence interval suitable for testing the claim that the mean IQ scores for subjects with medium lead levels is higher than the mean for subjects with high lead levels.
(Round to two decimal places as needed.)
Expert Solution
This question has been solved!
Explore an expertly crafted, step-by-step solution for a thorough understanding of key concepts.

Step by step
Solved in 2 steps with 2 images

Recommended textbooks for you
Glencoe Algebra 1, Student Edition, 9780079039897…
Algebra
ISBN:
9780079039897
Author:
Carter
Publisher:
McGraw Hill

Big Ideas Math A Bridge To Success Algebra 1: Stu…
Algebra
ISBN:
9781680331141
Author:
HOUGHTON MIFFLIN HARCOURT
Publisher:
Houghton Mifflin Harcourt
Glencoe Algebra 1, Student Edition, 9780079039897…
Algebra
ISBN:
9780079039897
Author:
Carter
Publisher:
McGraw Hill
Big Ideas Math A Bridge To Success Algebra 1: Stu…
Algebra
ISBN:
9781680331141
Author:
HOUGHTON MIFFLIN HARCOURT
Publisher:
Houghton Mifflin Harcourt