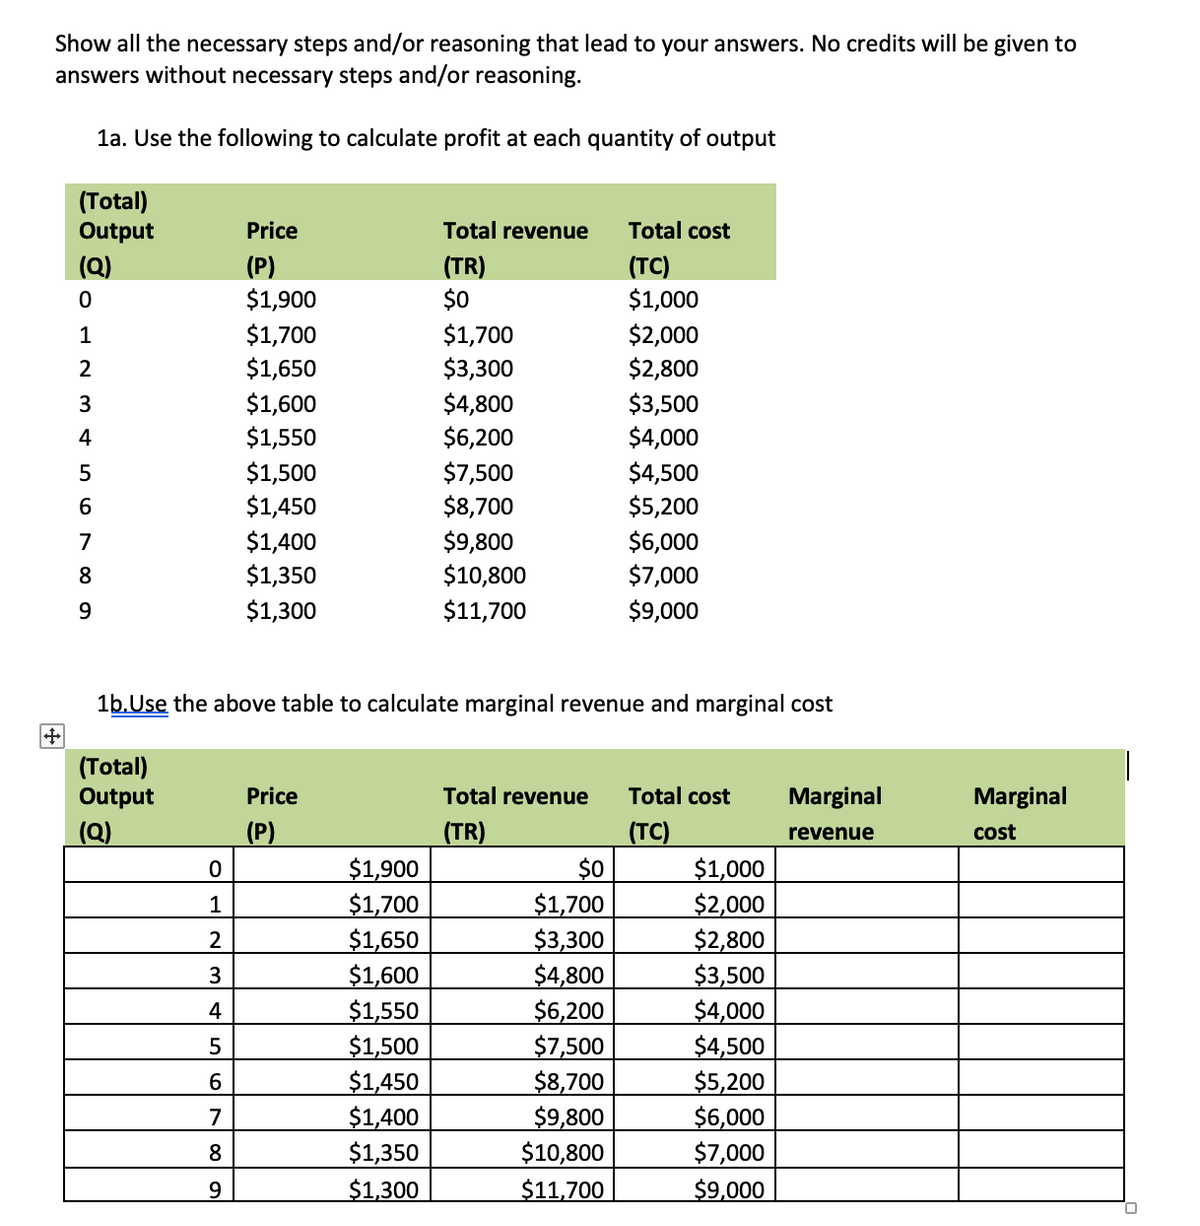
1c. Using Excel or grid paper, based on the above information, plot the demand curve, MR curve, MC curve and ATC curve. Label the profit-maximizing quantity and price, total cost, total revenue and profit.


Q: Complete the table with the values of the 3-unit moving average of the given function: bx r(x)…
A: The 3 - point moving average of the function , where is the average value of r(x) on [ x-3, x]
Q: QUESTION 20 You borrow $10,000 at an interest rate of 5% to open Movies Galore, a DVD rental store.…
A: Economic Profit can be defined as the profit earned when both explicit and implicit costs are…
Q: 7. Use of discretionary policy to stabilize the economy Should the government use monetary and…
A: Discretionary policy refers to the deliberate actions taken by government authorities, such as the…
Q: What is the Present worth difference of Alternative A and B. Capital investment Annual Cash inflow…
A: For present worth analysis, both alternatives should have equal service life otherwise take the LCM…
Q: Assume the market demand for carbonated water be given by QD = 200 − 5P. Assuming there are two…
A: In case of Cournot, firms decide to produce output simultaneously. Profit function of firm A: πA=…
Q: Consider data on every game played by the Brooklyn Nets in 2014 (82 games) that includes the…
A: Margin = α + βHome + e In this case home is a dummy variable that takes value 1 when it is home team…
Q: Civilian goods 10 9 7 s 4 W 8 C 1 2 3 Defense goods E What is the opportunity cost of going from…
A: Opportunity cost is an economic concept that refers to the value of the next best alternative that…
Q: How long will it take for 10,000 to amount to 50,000 if the interest rate is 6% compounded annually?…
A: Present value is the value of investment in today's dollar. Future value is the value of investment…
Q: A soybean farmer sells soybeans in a perfectly competitive market and hires labor in a perfectly…
A: Marginal revenue product is an additional revenue generated by an addition resource or input is…
Q: describe B2
A: Best response is the strategy which provides the best outcome to the concerned player, taking the…
Q: The formula (MPL)(MRX), where L is for labor and X is the output, is for the marginal revenue from…
A: Marginal product is the change in total product due to an additional labor hired. Marginal revenue…
Q: How does the law of supply and demand apply to the growing success of the urgent care medical market…
A: The law of supply and demand is a essential monetary principle that explains how the availability…
Q: sidering buying a house while he is at university. The house costs $200 000 today. Renting out part…
A: Annual value refers to the estimated yearly rental income that a property is expected to generate.…
Q: The Retread Tire Company recaps tires. The fixed annual cost of the recapping operation is $60,000.…
A: The breakeven point is a financial concept that refers to the level of sales or production at which…
Q: 4. In light of the answer in part 2, What is the minimum price at which the firm operates?
A: The firm will continue to operate in the economy upto the point when the Price is greater than the…
Q: Go to International Trade Centre (ITC) and use their tool of Investment Map to check Japan's total…
A: Investment refers to the act of allocating resources, such as money, time, or effort, with the…
Q: When you look at Gross Domestic Production (GDP) values of countries around the world, you notice…
A: In a country various commodities are produced during a given period of time. When the aggregate…
Q: If the demand for pizza falls, pizza suppliers will suffer economic losses and some firms will…
A: In economics, a market is an amalgamation of systems, organizations, infrastructures and relations…
Q: 1 2 W X y a 0,1 1,2 2,4 b 1,4 2,3 0,1 с 7,5 6,2 5,3 Is player 1's strategy x dominated? If yes,…
A: A dominant strategy refers to a course of action that yields the highest payoff for a player,…
Q: the question is asking decrease in consumer confidence, so all things should be the opposite
A: Aggregate demand refers to the overall spending on final goods and services within an economy. It…
Q: By drawing a diagram of labor demand and labor supply curves, illustrate how workers and firms share…
A: The equilibrium wage rate and quantity of labor employed in a market are determined by the…
Q: Acme Specialty Products has determined that the demand function for their heated socks is given by:…
A: Elasticity of demand measures the responsiveness of quantity demanded to changes in price levels.
Q: You just purchased a pin-inserting machine to relieve some bottleneck problems that have been…
A: Salvage value refers to the estimated residual value of an asset at the end of its useful life or…
Q: What is most striking to you in the contemporary development of Mexico?
A: Economic growth is a fundamental aspect of contemporary development in Mexico. The country has…
Q: In 1996, a group of American doctors called for a limit on the number of foreign-trained physicians…
A: The variables of demand and supply are what make up that impact the connection between sellers and…
Q: You work for the Committee for Economic Evaluation in the small nation of Kinsdale. Your current job…
A: GDP is the gross domestic product. GDP is defined as the monetary value of all the goods and…
Q: Why is an increase in the concentration of carbon dioxide in the atmosphere associated with a social…
A: An increase in the concentration of carbon dioxide (CO2) in the atmosphere is related to a social…
Q: Explain with clear brief points with correct answer - please do not attempt to answer if you are not…
A: This article is studying the relationship between the hammer price and the scrap value of silver…
Q: Price Level 0 100 Figure 10.3 200 1 AD 300 400 500 600 700 Real Output Multiple Choice AD3 to AD2…
A: Aggregate demand is the sum of Consumption, Investment, government spending and net export.…
Q: Identify two products that have either (a) fallen sharply in price or (b) gotten significantly…
A: Price refers to the monetary value assigned to a product or service in a market. It represents the…
Q: Thuy Anh runs a small flower shop in the town of Florabunda. She is debating whether she should…
A: Firms weigh the marginal revenue of the last hour's work against the marginal cost when determining…
Q: 108. An initial transportation solution appears in the table. C D Factory Capacity 10 0 10 15 25 40…
A: Given:- Cost from A to C=$5Cost from A to D=$7Cost from B to C=$8Cost from B to D=$9 To know:-…
Q: What is the Present Worth of Machine A? A firm is considering the purchase of one of two new…
A: Given Initial Cost FC =3400 Service life 3 year Salvage value =100 Operating cost =2000 per year…
Q: The JSE tracked firmer global peers on Wednesday as anxiety surrounding the global banking sector…
A: The sustained rise in general price level of goods and services in an economy over a period of time…
Q: You are a college sophomore who tutors fellow classmates in your free time for extra money. With…
A: Earning by tutoring=2000 per year for 3 years If takes training Training cost=6000 and not able to…
Q: What is the actual value on the Mec?
A: In this case, we have to discuss the marginal efficiency of capital. Marginal Efficiency of Capital…
Q: As the accounting industry expands, the demand for certified public accountants (CPAs) also…
A: Demand refers to the desire or willingness of individuals or organizations to purchase a particular…
Q: Develop a spreadsheet model to determine how much a person or a couple can afford to spend on a…
A: Total monthly gross income = $6000 Non-mortgage housing expense = $300 Monthly installment debt =…
Q: The ethanol industry is perfectly competitive, and each producer has the long-run marginal cost…
A: In perfect competition, There exists a large number of buyers and sellers. The firm will produce…
Q: A firm is currently hiring capital and labor so that MPL/PL<MPK/PK, if the firm wishes to maximize…
A: Marginal product of an input is the additional output produced by using additional unit of the input
Q: A single firm is the only employer in a labour market. The marginal revenue product, labour supply,…
A: As it is mentioned that there is a single firm acting as employer that is demanding labor, therefore…
Q: 50 45+ 40 35 30 25 20+ 15 10 Price MR -MC-ATC Demand 50 100 150 200 250 300 350 400 450 500 550 600…
A: The consumer surplus is the gap between the maximum price a consumer surplus is willing to pay and…
Q: Suppose the following graph shows what prevailed on the foreign exchange market in 2015 with…
A: The value of one currency in another currency's terms is known as the nominal exchange rate. It also…
Q: The table below lists the marginal product per hour of workers in a lightbulb factory. Lightbulbs…
A: The value of the marginal product to labor is calculated by multiplying the price of goods by the…
Q: Question(4): A power plant is being considered in the dead sea location. For an initial investment…
A: Payback period is the number of years that an investment takes to recover its purchase value.…
Q: The following diagram shows the Lorenz curves for three countries. Country X's Lorenz curve is shown…
A: The amount of inequality in an income distribution is measured by Gini coeeficient. Lorenz curve is…
Q: What is the Present worth of the project? An investment of 5million will yield a revenue of 2.5…
A: Present worth, otherwise called present value or discounted value, is a financial idea used to…
Q: Exercise 5.2 Given the intertemporal production possibilities frontier to the right. Point A…
A: Suppose: C2 : future consumption R : real interest rate Value of future consumption today is…
Q: Because perfectly competitive firms must accept the _________________ curve (demand or supply) for…
A: Perfect competition is a market structure where firms have limited control over the price they…
Q: ractice midterm questions eview 10 PLEASE IGNORE Consider the supply and demand diagram…
A: We have to find out the quantity sold after tax
1c. Using Excel or grid paper, based on the above information, plot the demand curve, MR curve, MC curve and


Trending now
This is a popular solution!

Step by step
Solved in 3 steps with 1 images


- (Module 52) Theo sells baby rattles at $3 per unit and each month he sells 3000 units out of the back of his wagon in the city park. Theo has no employees and estimates he could rent his wagon to another entrepreneur for $2000 each month. He also knows that he could earn about $5000 a month as a model. He pays $1 per unit for plastic, his only raw material. a. Calculate Theo’s total monthly revenue. b. Calculate Theo’s accounting profit. Show your work. c. Calculate Theo’s economic profit. Show your work. d. Should Theo continue to sell his baby rattles in the park? Explain.In which market structure does Johnson Electronics (Pty) Ltd operate? Provide areason for your answer and what level of output maximizes the firm’s profit? Provide the reason for youranswer output price total revenue average cost total cost margnial cost profit/ loss 10 10.00 100 20.80 208 0 -108 20 10.00 200 12.40 248 4.00 -48 30 10.00 300 9.90 297 5.00 3 40 10.00 400 9.00 360 6.20 40 50 10.00 500 8.80 440 8.00 60 60 10.00 600 9.00 540 10.00 605. El Sol Inc. produces beach towels. The cost of each towel is $ 4.00 and it sells for $ 10.00 after the markup on its cost. Similar towels sell for $ 8.00. How much should each towel cost you to be able to adjust to the market price and keep your profit margin?
- Q3_A The Break even Analysis of firm show that: BEP = 1000 FC = 10,000 $ P = 3% of the quantity of zero profit. A) The point of intersection of TR with TC is at the cost point of $ 45,000 for TR. B) At the point where (zero units sold) TC equals $ 5,000 C) the start of the line drawing for TR is at cost point $ 0 D) the value UVC for the product in question equals $ 10) E)the FC value in a point for BFP equals $ 10,000 For the given choices, showing which one is True and which one is False, correcting the False ones and given a reasonable reason for the True. Write your answer below:General Motors, the automobile manufacturing company, recently ran an advertisement for its cars. It offered a 21% discount on its suggested retail price on all of its cars only to “current competitive owners” - anyone who is currently owning or leasing a NON-General Motors car. Customers must show proof of ownership (or lease) of a 2001 model year or newer non-GM vehicle dated at least 30 days prior to the sale of a new General Motors car. 1) How does General Motors benefit from selling cars at a 21% discount to non-GM owners? Explain why this pricing strategy increases General Motors’ revenues and profits versus selling all General Motors cars at one price. Be sure to use economic concepts used in the class for your answer. 2) Why does General Motors require proof of ownership (or lease) of a non-GM vehicle? Explains how this benefits General Motors.c. Note that these results imply the marginal revenue, or marginal benefit, of website analysis is MB(X) = 11.09 − 0.2 × X and the marginal cost of website analysis is MC(X) = 0.21 × X. What level of website analysis will maximize net benefits? Round to the nearest hundredth.
- 6. A firm manufactures and markets a product that sells for Birr 20 per unit. Fixed costs associated with activity total Birr 40,000 a month, while variable cost per unit is Birr 10. A maximum of 10,000 units can be produced and sold. Required: a) Drive the TR, TC and Total profit functions. b) Sketch the TR, TC and Total profit functions in the same coordinate system. c) What is the Break-even point (in terms of quantity and sales volume)? d) Drives the new TC, Total profit functions given that FC is increased by Birr 10,000 a month, and calculate the new break-even point. e) Drive the new TC and Total profit functions given that unit variable costs is decreased by 20% and calculate the new Break-even point. f) Drive the new TR and Total profits functions given that the unit selling price increases by 20% and calculate the new break-even point. g) What is the relationship that you may inter from BEP& FC, P& BEP and V& BEP? h) Assume selling prince increases by 10%…A computer hardware firm sells both laptop computers and printers. Their pricing team determines that there are 3 types of customers with the following willingness to pay: Laptop Printer Customer Type A $800 $100 $900 Customer Type B $1,000 $50 $1050 Customer Type C $600 $150 $750 If the firm were to change only individual prices, what prices should it charge for its laptops and printers? Assume for simplicity that the firm has only 1 customer of each type and that incremental costs for laptops and printers = $0. How much profit does the firm earn? How much consumer surplus will there be?Your aunt is thinking about opening a hardware store. She estimates that it would cost $500,000 per year to rent the location and buy the stock. In addition, she would have to quit her $50,000 per year job as an accountant. Your aunt’s opportunity costs comprise * If your aunt thought she could sell $510,000 worth of merchandise in a year, what is your aunt’s accounting profit? *$10,000-$40,000$460,000$0Given the above situation, what is your aunt’s economic profit? *$10,000-$40,000$460,000$0
- Over the course of a customer’s lifetime of reading a weekly magazine priced at $4 per issue, what is the value of the magazine? Assume a customer acquisition cost of $12, a retention cost of $0, printing and distribution costs of $1, an annual retention rate of 77% and an annual discount rate of 2.6%. Assume that price and non-marketing variable costs remain constant over the customer’s lifetime of reading the magazine. Options: A) 10.05 B) 30.50 C) 73.49 D) 14.20 E) 0.02 F) 261.252 Your current prices are $311 in the southwestern region, $278 in the western region, and $240 in the New England region. Your marginal cost is now $212.21. Given the predicted changes in the quantity demanded by region per problem 1 and using the stay even analysis %ΔQd = %ΔP/[%ΔP + ((P-MC)/P)], can you raise the price by 7% in any of the regional markets? State you conclusion and then show all the steps supporting your conclusion. Round to one decimal place, i.e. 10.135 is 10.1 (Note you are not being asked to compute the new price.).Output AFC AVC ATC MC 1 300 100 400 100 2 150 75 225 50 3 100 70 170 60 4 75 73 148 80 5 60 80 140 110 6 50 90 140 140 7 43 103 146 180 8 38 119 156 230 9 33 138 171 290 10 30 160 190 360 Refer to the chart above. If the market price is $179, the per-unit economic profit at the profit maximizing output is what? 15 23 33 39