2= -0.04 2=12 The area of the shaded region is (Round to four decimal places as needed.) 2- Find the indicated z score. The graph depicts the standard normal distribution with mean 0 and standard deviation 1. Click to view page 1 of the table. Click to view page 2 of the table 0.9382 The indicated z score is (Round to two decimal places as needed.) Find the indicated IQ score. The graph to the right depicts IQ scores of adults, and those scores are normally distributed with a mean of 100 and a standard deviation of 15. Click to view page 1 of the table. Click to view page 2 of the table 0.99 The indicated IQ score, x, is (Round to one decimal place as needed.)
2= -0.04 2=12 The area of the shaded region is (Round to four decimal places as needed.) 2- Find the indicated z score. The graph depicts the standard normal distribution with mean 0 and standard deviation 1. Click to view page 1 of the table. Click to view page 2 of the table 0.9382 The indicated z score is (Round to two decimal places as needed.) Find the indicated IQ score. The graph to the right depicts IQ scores of adults, and those scores are normally distributed with a mean of 100 and a standard deviation of 15. Click to view page 1 of the table. Click to view page 2 of the table 0.99 The indicated IQ score, x, is (Round to one decimal place as needed.)

Glencoe Algebra 1, Student Edition, 9780079039897, 0079039898, 2018
18th Edition
ISBN:9780079039897
Author:Carter
Publisher:Carter
Chapter10: Statistics
Section10.4: Distributions Of Data
Problem 22PFA

Related questions
Question
100%
13,14,16-Hi Wonderful Bartleby team,
I need help with these 3 short exercises from stats. (Thanks in advance)
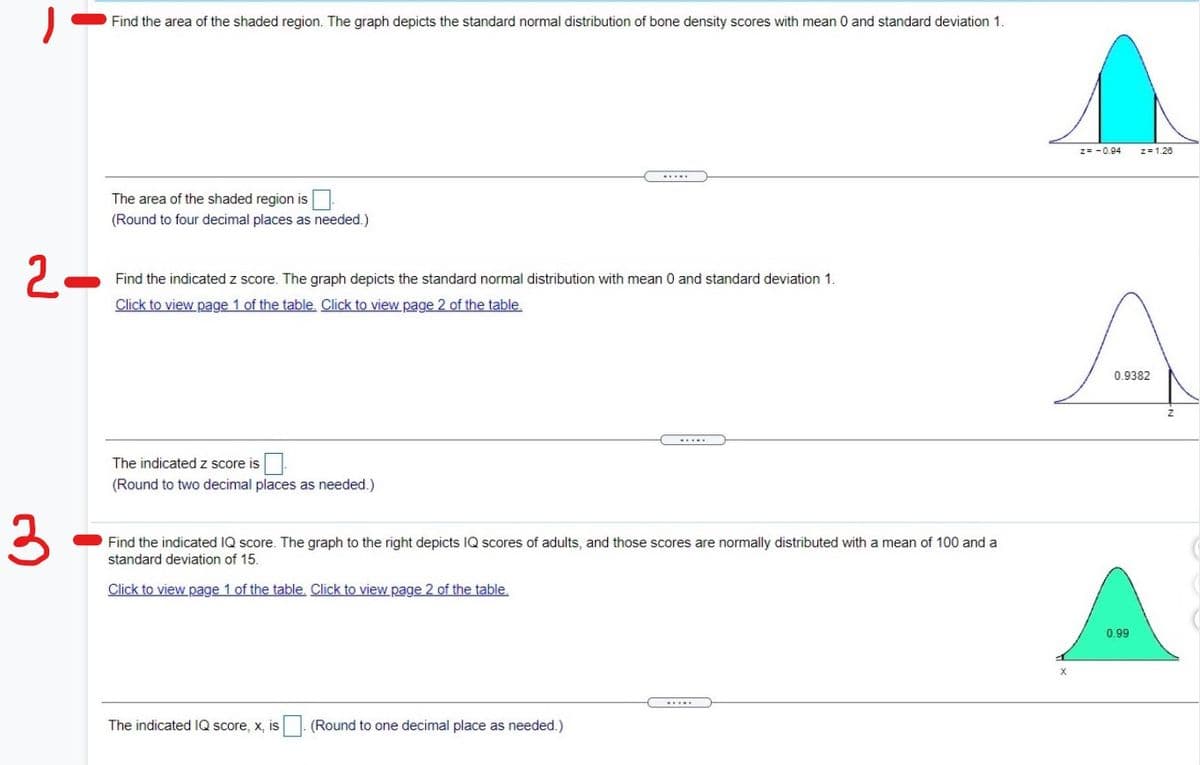
Transcribed Image Text:Find the area of the shaded region. The graph depicts the standard normal distribution of bone density scores with mean 0 and standard deviation 1.
2= -0.94
z=1.20
The area of the shaded region is
(Round to four decimal places as needed.)
2-
Find the indicated z score. The graph depicts the standard normal distribution with mean 0 and standard deviation 1.
Click to view page 1 of the table. Click to view page 2 of the table.
0.9382
.....
The indicated z score is
(Round to two decimal places as needed.)
3
Find the indicated IQ score. The graph to the right depicts IQ scores of adults, and those scores are normally distributed with a mean of 100 and a
standard deviation of 15.
Click to view page 1 of the table, Click to view page 2 of the table,
0.99
....
The indicated IQ score, x, is . (Round to one decimal place as needed.)
Expert Solution
This question has been solved!
Explore an expertly crafted, step-by-step solution for a thorough understanding of key concepts.

This is a popular solution!

Trending now
This is a popular solution!

Step by step
Solved in 2 steps with 2 images

Recommended textbooks for you
Glencoe Algebra 1, Student Edition, 9780079039897…
Algebra
ISBN:
9780079039897
Author:
Carter
Publisher:
McGraw Hill

Big Ideas Math A Bridge To Success Algebra 1: Stu…
Algebra
ISBN:
9781680331141
Author:
HOUGHTON MIFFLIN HARCOURT
Publisher:
Houghton Mifflin Harcourt
Glencoe Algebra 1, Student Edition, 9780079039897…
Algebra
ISBN:
9780079039897
Author:
Carter
Publisher:
McGraw Hill
Big Ideas Math A Bridge To Success Algebra 1: Stu…
Algebra
ISBN:
9781680331141
Author:
HOUGHTON MIFFLIN HARCOURT
Publisher:
Houghton Mifflin Harcourt