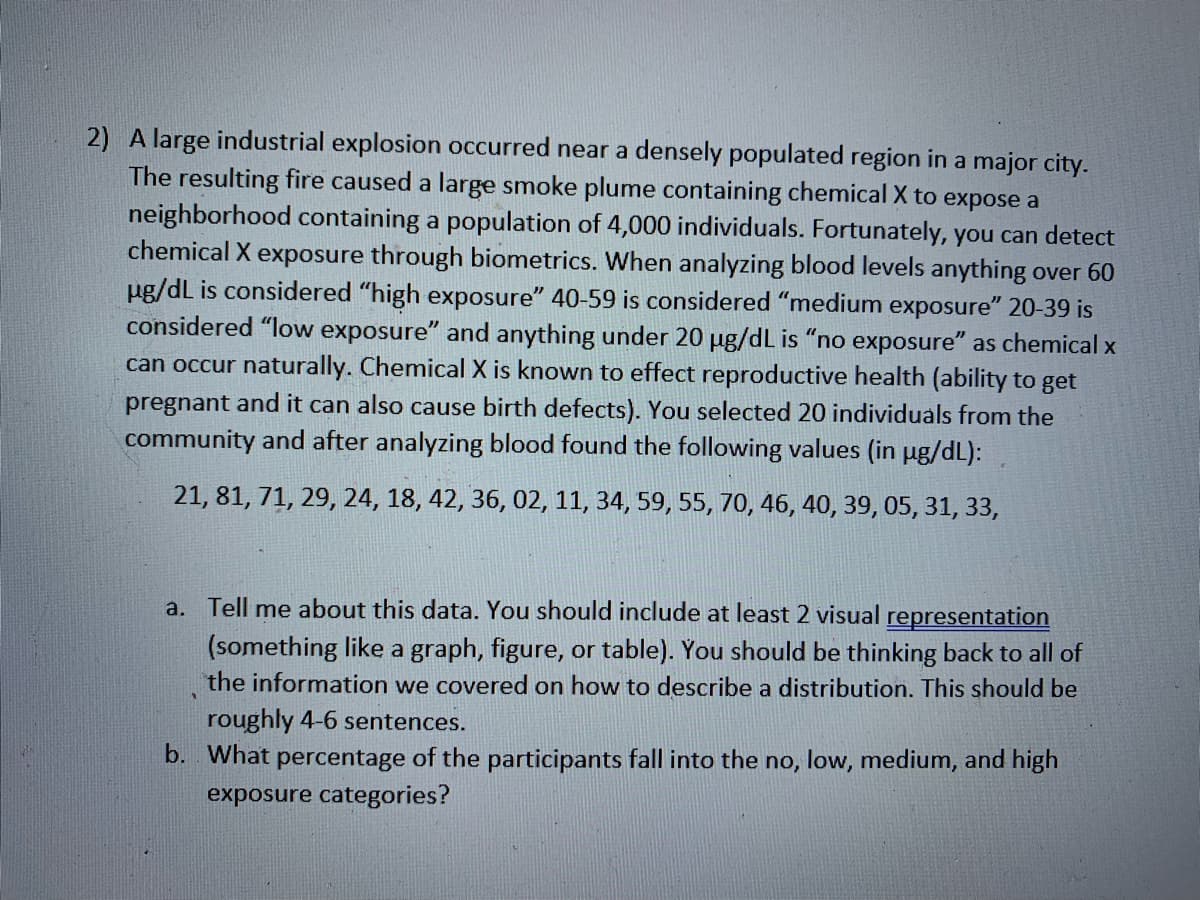
2) A large industrial explosion occurred near a densely populated region in a major city. The resulting fire caused a large smoke plume containing chemical X to expose a neighborhood containing a population of 4,000 individuals. Fortunately, you can detect chemical X exposure through biometrics. When analyzing blood levels anything over 60 pg/dL is considered "high exposure" 40-59 is considered "medium exposure" 20-39 is considered "low exposure" and anything under 20 µg/dL is “no exposure" as chemical x can occur naturally. Chemical X is known to effect reproductive health (ability to get pregnant and it can also cause birth defects). You selected 20 individuals from the community and after analyzing blood found the following values (in µg/dL): 21, 81, 71, 29, 24, 18, 42, 36, 02, 11, 34, 59, 55, 70, 46, 40, 39, 05, 31, 33, a. Tell me about this data. You should include at least 2 visual representation (something like a graph, figure, or table). You should be thinking back to all of the information we covered on how to describe a distribution. This should be roughly 4-6 sentences. b. What percentage of the participants fall into the no, low, medium, and high exposure categories?
2) A large industrial explosion occurred near a densely populated region in a major city. The resulting fire caused a large smoke plume containing chemical X to expose a neighborhood containing a population of 4,000 individuals. Fortunately, you can detect chemical X exposure through biometrics. When analyzing blood levels anything over 60 pg/dL is considered "high exposure" 40-59 is considered "medium exposure" 20-39 is considered "low exposure" and anything under 20 µg/dL is “no exposure" as chemical x can occur naturally. Chemical X is known to effect reproductive health (ability to get pregnant and it can also cause birth defects). You selected 20 individuals from the community and after analyzing blood found the following values (in µg/dL): 21, 81, 71, 29, 24, 18, 42, 36, 02, 11, 34, 59, 55, 70, 46, 40, 39, 05, 31, 33, a. Tell me about this data. You should include at least 2 visual representation (something like a graph, figure, or table). You should be thinking back to all of the information we covered on how to describe a distribution. This should be roughly 4-6 sentences. b. What percentage of the participants fall into the no, low, medium, and high exposure categories?

Linear Algebra: A Modern Introduction
4th Edition
ISBN:9781285463247
Author:David Poole
Publisher:David Poole
Chapter4: Eigenvalues And Eigenvectors
Section4.6: Applications And The Perron-frobenius Theorem
Problem 25EQ

Related questions
Question
Answer part a and b.
Transcribed Image Text:2) A large industrial explosion occurred near a densely populated region in a major city.
The resulting fire caused a large smoke plume containing chemical X to expose a
neighborhood containing a population of 4,000 individuals. Fortunately, you can detect
chemical X exposure through biometrics. When analyzing blood levels anything over 60
ug/dL is considered "high exposure" 40-59 is considered "medium exposure" 20-39 is
considered "low exposure" and anything under 20 µg/dL is "no exposure" as chemical x
can occur naturally. Chemical X is known to effect reproductive health (ability to get
pregnant and it can also cause birth defects). You selected 20 individuals from the
community and after analyzing blood found the following values (in ug/dL):
21, 81, 71, 29, 24, 18, 42, 36, 02, 11, 34, 59, 55, 70, 46, 40, 39, 05, 31, 33,
a. Tell me about this data. You should include at least 2 visual representation
(something like a graph, figure, or table). You should be thinking back to all of
the information we covered on how to describe a distribution. This should be
roughly 4-6 sentences.
b. What percentage of the participants fall into the no, low, medium, and high
exposure categories?
Expert Solution
This question has been solved!
Explore an expertly crafted, step-by-step solution for a thorough understanding of key concepts.

This is a popular solution!

Trending now
This is a popular solution!

Step by step
Solved in 3 steps with 1 images

Recommended textbooks for you
Linear Algebra: A Modern Introduction
Algebra
ISBN:
9781285463247
Author:
David Poole
Publisher:
Cengage Learning

Glencoe Algebra 1, Student Edition, 9780079039897…
Algebra
ISBN:
9780079039897
Author:
Carter
Publisher:
McGraw Hill
Linear Algebra: A Modern Introduction
Algebra
ISBN:
9781285463247
Author:
David Poole
Publisher:
Cengage Learning
Glencoe Algebra 1, Student Edition, 9780079039897…
Algebra
ISBN:
9780079039897
Author:
Carter
Publisher:
McGraw Hill