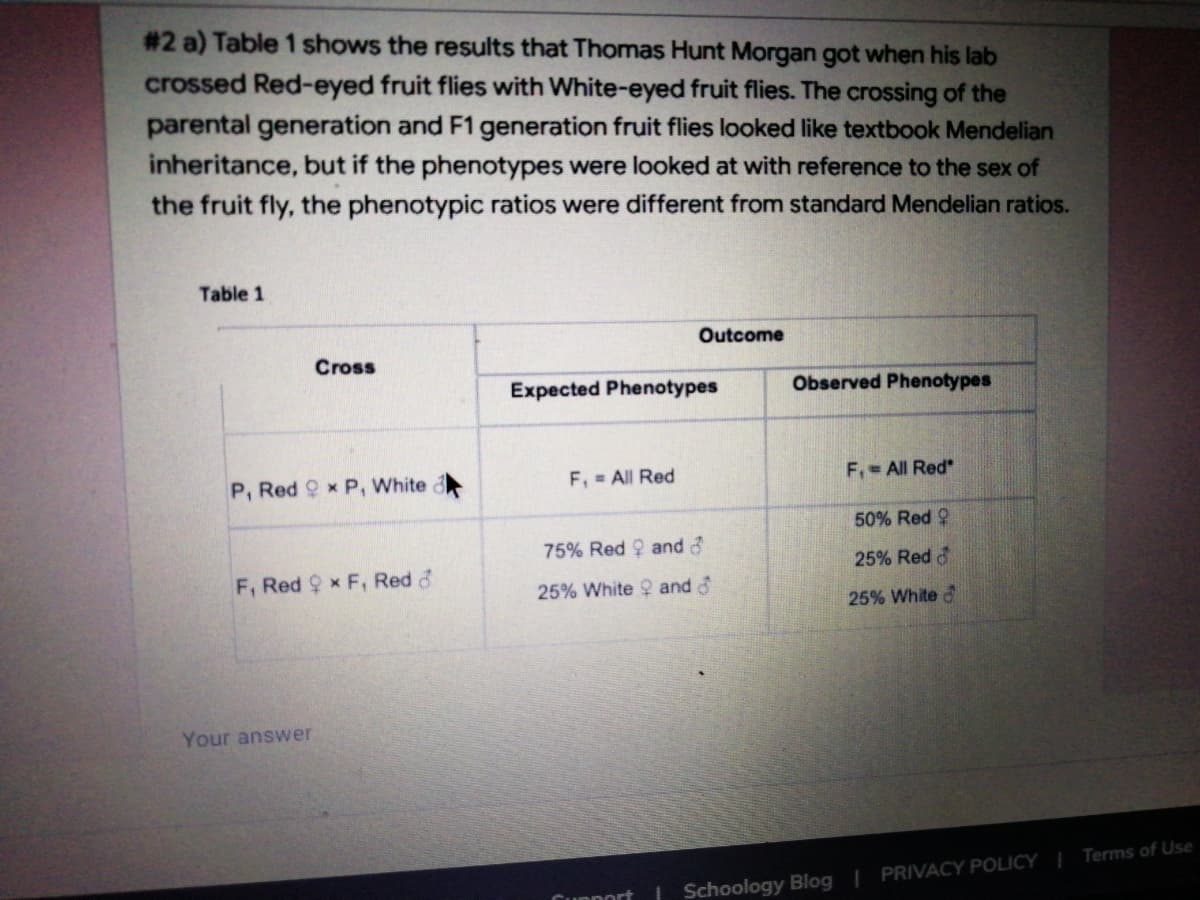
#2 a) Table 1 shows the results that Thomas Hunt Morgan got when his lab crossed Red-eyed fruit flies with White-eyed fruit flies. The crossing of the parental generation and F1 generation fruit flies looked like textbook Mendelian inheritance, but if the phenotypes were looked at with reference to the sex of the fruit fly, the phenotypic ratios were different from standard Mendelian ratios. Table 1 Outcome Cross Expected Phenotypes Observed Phenotypes F, All Red F, = All Red P, Red 9 x P, White 50% Red 9 75% Red ? and ở 25% Red d F, Red 9 x F, Red d 25% White 2 and d 25% White &
#2 a) Table 1 shows the results that Thomas Hunt Morgan got when his lab crossed Red-eyed fruit flies with White-eyed fruit flies. The crossing of the parental generation and F1 generation fruit flies looked like textbook Mendelian inheritance, but if the phenotypes were looked at with reference to the sex of the fruit fly, the phenotypic ratios were different from standard Mendelian ratios. Table 1 Outcome Cross Expected Phenotypes Observed Phenotypes F, All Red F, = All Red P, Red 9 x P, White 50% Red 9 75% Red ? and ở 25% Red d F, Red 9 x F, Red d 25% White 2 and d 25% White &

Concepts of Biology
1st Edition
ISBN:9781938168116
Author:Samantha Fowler, Rebecca Roush, James Wise
Publisher:Samantha Fowler, Rebecca Roush, James Wise
Chapter8: Patterns Of Inheritance
Section: Chapter Questions
Problem 2ACQ: Figure 8.10 In pea plants, purple flowers (P) are dominant to white (p), and yellow peas (Y) are...

Related questions

Topic Video
Question
Transcribed Image Text:# 2 a) Table 1 shows the results that Thomas Hunt Morgan got when his lab
crossed Red-eyed fruit flies with White-eyed fruit flies. The crossing of the
parental generation and F1 generation fruit flies looked like textbook Mendelian
inheritance, but if the phenotypes were looked at with reference to the sex of
the fruit fly, the phenotypic ratios were different from standard Mendelian ratios.
Table 1
Outcome
Cross
Expected Phenotypes
Observed Phenotypes
F, = All Red
F,- All Red
P, Red 9 x P, White
50% Red 9
75% Red 9 and &
25% Red d
F, Red 9 x F, Red d
25% White ? and d
25% White d
Your answer
Cupport
| Schoology Blog | PRIVACY POLICY | Terms of Use
Expert Solution
Step 1
T.H. Morgan with the help of this experiment demonstrated the X-linked pattern of inheritance. When a particular gene is present on the autosomes of male and female then in next generation they will produce an expected phenotype and ratio as Mendelian inheritance. When the genes are present on sex chromosomes then the inheritance is deviated from the typical Mendelian ratio. T.H. Morgan demonstrated this deviation from Mendelian ration through this experiment.

Step by step
Solved in 3 steps with 1 images

Knowledge Booster


Learn more about
Need a deep-dive on the concept behind this application? Look no further. Learn more about this topic, biology and related others by exploring similar questions and additional content below.Recommended textbooks for you
Concepts of Biology
Biology
ISBN:
9781938168116
Author:
Samantha Fowler, Rebecca Roush, James Wise
Publisher:
OpenStax College

Human Heredity: Principles and Issues (MindTap Co…
Biology
ISBN:
9781305251052
Author:
Michael Cummings
Publisher:
Cengage Learning
Concepts of Biology
Biology
ISBN:
9781938168116
Author:
Samantha Fowler, Rebecca Roush, James Wise
Publisher:
OpenStax College
Human Heredity: Principles and Issues (MindTap Co…
Biology
ISBN:
9781305251052
Author:
Michael Cummings
Publisher:
Cengage Learning