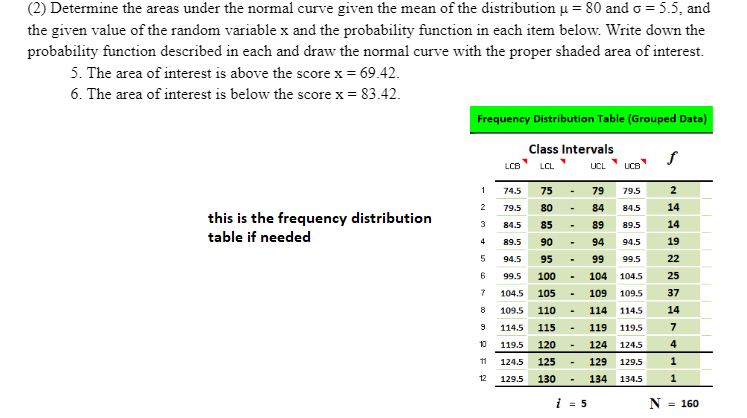
(2) Determine the areas under the normal curve given the mean of the distribution µ = 80 and o = 5.5, and the given value of the random variable x and the probability function in each item below. Write down the probability function described in each and draw the normal curve with the proper shaded area of interest. 5. The area of interest is above the score x = 69.42. 6. The area of interest is below the score x = 83.42.
(2) Determine the areas under the normal curve given the mean of the distribution µ = 80 and o = 5.5, and the given value of the random variable x and the probability function in each item below. Write down the probability function described in each and draw the normal curve with the proper shaded area of interest. 5. The area of interest is above the score x = 69.42. 6. The area of interest is below the score x = 83.42.

A First Course in Probability (10th Edition)
10th Edition
ISBN:9780134753119
Author:Sheldon Ross
Publisher:Sheldon Ross
Chapter1: Combinatorial Analysis
Section: Chapter Questions
Problem 1.1P: a. How many different 7-place license plates are possible if the first 2 places are for letters and...

Related questions
Question
Transcribed Image Text:(2) Determine the areas under the normal curve given the mean of the distribution u = 80 and o = 5.5, and
the given value of the random variable x and the probability function in each item below. Write down the
probability function described in each and draw the normal curve with the proper shaded area of interest.
5. The area of interest is above the score x = 69.42.
6. The area of interest is below the score x = 83.42.
Frequency Distribution Table (Grouped Data)
Class Intervals
LCB LCL
UCL
UCB
1
74.5
75
79
79.5
2
2
79.5
80
84
84.5
14
this is the frequency distribution
3
84.5
85
89
89.5
14
table if needed
4
89.5
90
94
94.5
19
94.5
95
99
99.5
22
99.5
100
104
104.5
25
104.5
105
109
109.5
37
8
109.5
110
114 114.5
14
114.5
115
119 119.5
7
10
119.5
120
124 124.5
4
11
124.5
125
129
129.5
12
129.5
130
134
134.5
1
i = 5
N
= 160
Expert Solution
This question has been solved!
Explore an expertly crafted, step-by-step solution for a thorough understanding of key concepts.

Step by step
Solved in 3 steps with 3 images

Recommended textbooks for you
A First Course in Probability (10th Edition)
Probability
ISBN:
9780134753119
Author:
Sheldon Ross
Publisher:
PEARSON

A First Course in Probability (10th Edition)
Probability
ISBN:
9780134753119
Author:
Sheldon Ross
Publisher:
PEARSON