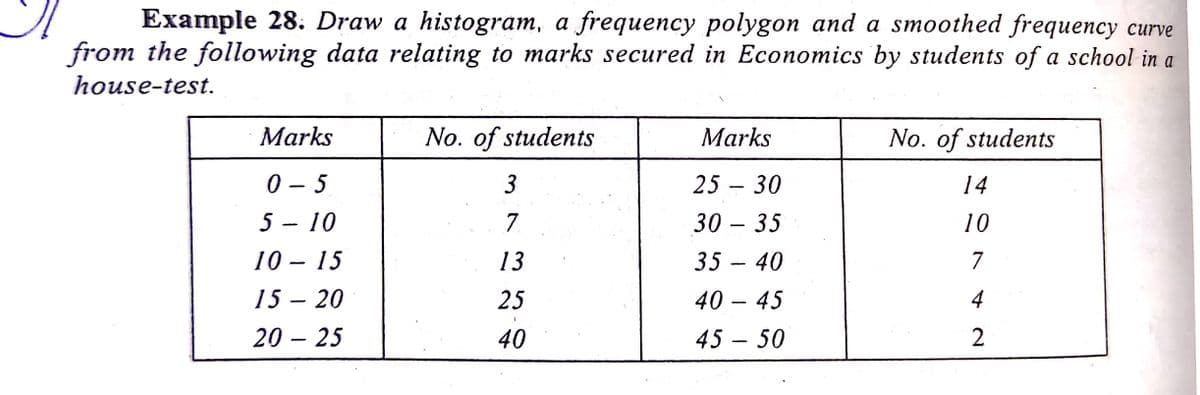
Example 28. Draw a histogram, a frequency polygon and a smoothed frequency curve from the following data relating to marks secured in Economics by students of a school in a house-test. Marks No. of students Marks No. of students 0 - 5 3 25 - 30 14 5 - 10 7 30 – 35 10 10 – 15 13 35 – 40 7 15 – 20 25 40 – 45 4 20 – 25 40 45 – 50
Example 28. Draw a histogram, a frequency polygon and a smoothed frequency curve from the following data relating to marks secured in Economics by students of a school in a house-test. Marks No. of students Marks No. of students 0 - 5 3 25 - 30 14 5 - 10 7 30 – 35 10 10 – 15 13 35 – 40 7 15 – 20 25 40 – 45 4 20 – 25 40 45 – 50

Glencoe Algebra 1, Student Edition, 9780079039897, 0079039898, 2018
18th Edition
ISBN:9780079039897
Author:Carter
Publisher:Carter
Chapter10: Statistics
Section10.6: Summarizing Categorical Data
Problem 4BGP

Related questions
Question
Transcribed Image Text:Example 28. Draw a histogram, a frequency polygon and a smoothed frequency curve
from the following data relating to marks secured in Economics by students of a school in a
house-test.
Marks
No. of students
Marks
No. of students
0 - 5
25 – 30
14
|
5 - 10
7.
30 – 35
10
10 – 15
13
35 - 40
7
15 – 20
25
40 – 45
4
20 – 25
40
45 – 50
2
3.
Expert Solution
This question has been solved!
Explore an expertly crafted, step-by-step solution for a thorough understanding of key concepts.

Step by step
Solved in 2 steps with 2 images

Recommended textbooks for you
Glencoe Algebra 1, Student Edition, 9780079039897…
Algebra
ISBN:
9780079039897
Author:
Carter
Publisher:
McGraw Hill
Glencoe Algebra 1, Student Edition, 9780079039897…
Algebra
ISBN:
9780079039897
Author:
Carter
Publisher:
McGraw Hill