2 pts The following is the result of the multiple linear regression analysis in STATISTICA, where the response Y-lung capacity of a person, rage age of the person in years, Zheight height of the person in inches, rmoke Cacsarean delivery), based on a total of 725 persons. -a categorical variable with 2 levels (0-non-smoker, 1 smoker), and -a categorical variable with 2 levels (0 -normal delivery, 1 Caesarean-section Analysis of Variance; DV: LungCap (LungCapacityData) Mean Sums of df p-value Squares Squares 4358.145 772.327 5130.472 Elfect 0.00 Regress Residual Total The percentage of total variation in Y that is accounted for by the linear regression model (answer with % adjusted by taking into account the number of predictor variables is sign to 2 decimal places, e.g. 93.89%)
2 pts The following is the result of the multiple linear regression analysis in STATISTICA, where the response Y-lung capacity of a person, rage age of the person in years, Zheight height of the person in inches, rmoke Cacsarean delivery), based on a total of 725 persons. -a categorical variable with 2 levels (0-non-smoker, 1 smoker), and -a categorical variable with 2 levels (0 -normal delivery, 1 Caesarean-section Analysis of Variance; DV: LungCap (LungCapacityData) Mean Sums of df p-value Squares Squares 4358.145 772.327 5130.472 Elfect 0.00 Regress Residual Total The percentage of total variation in Y that is accounted for by the linear regression model (answer with % adjusted by taking into account the number of predictor variables is sign to 2 decimal places, e.g. 93.89%)

Glencoe Algebra 1, Student Edition, 9780079039897, 0079039898, 2018
18th Edition
ISBN:9780079039897
Author:Carter
Publisher:Carter
Chapter10: Statistics
Section10.4: Distributions Of Data
Problem 20PFA

Related questions
Question
Transcribed Image Text:2 pts
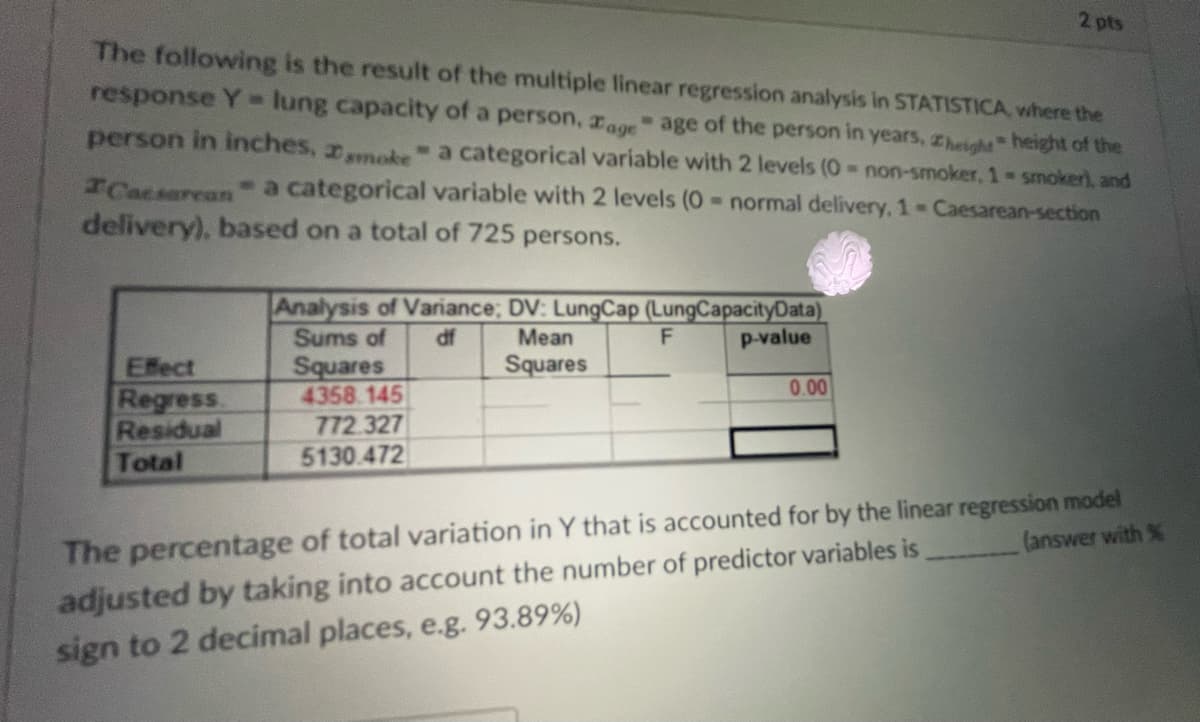
The following is the result of the multiple linear regression analysis in STATISTICA, where the
response Y lung capacity of a person, rage age of the person in years, zheight" height of the
person in inches, mtra categorical variable with 2 levels (0 -non-smoker, 1- smoker), and
-a categorical variable with 2 levels (0 =normal delivery, 1 Caesarean--section
Cacsarean
delivery), based on a total of 725 persons.
Analysis of Variance; DV: LungCap (LungCapacityData)
Sums of
df
Mean
p-value
Elfect
Regress
Residual
Total
Squares
4358.145
772.327
5130.472
Squares
0.00
The percentage of total variation in Y that is accounted for by the linear regression model
(answer with %
adjusted by taking into account the number of predictor variables is
sign to 2 decimal places, e.g. 93.89%)
Expert Solution
This question has been solved!
Explore an expertly crafted, step-by-step solution for a thorough understanding of key concepts.

Step by step
Solved in 2 steps

Recommended textbooks for you
Glencoe Algebra 1, Student Edition, 9780079039897…
Algebra
ISBN:
9780079039897
Author:
Carter
Publisher:
McGraw Hill


Big Ideas Math A Bridge To Success Algebra 1: Stu…
Algebra
ISBN:
9781680331141
Author:
HOUGHTON MIFFLIN HARCOURT
Publisher:
Houghton Mifflin Harcourt
Glencoe Algebra 1, Student Edition, 9780079039897…
Algebra
ISBN:
9780079039897
Author:
Carter
Publisher:
McGraw Hill
Big Ideas Math A Bridge To Success Algebra 1: Stu…
Algebra
ISBN:
9781680331141
Author:
HOUGHTON MIFFLIN HARCOURT
Publisher:
Houghton Mifflin Harcourt