2) The following data represent the difference in scores between the winning and losing teams in a sample of 15 college football bowl games from 2004-2005. Point Difference | Number of Bowl Games 1- 5 6 - 10 11 - 15 16 - 20 21 - 25 2 3 1 26 - 30 31 - 35 1
2) The following data represent the difference in scores between the winning and losing teams in a sample of 15 college football bowl games from 2004-2005. Point Difference | Number of Bowl Games 1- 5 6 - 10 11 - 15 16 - 20 21 - 25 2 3 1 26 - 30 31 - 35 1

Glencoe Algebra 1, Student Edition, 9780079039897, 0079039898, 2018
18th Edition
ISBN:9780079039897
Author:Carter
Publisher:Carter
Chapter10: Statistics
Section10.3: Measures Of Spread
Problem 1GP

Related questions
Question
Find and interpret the measure of the position of the Q2 median.
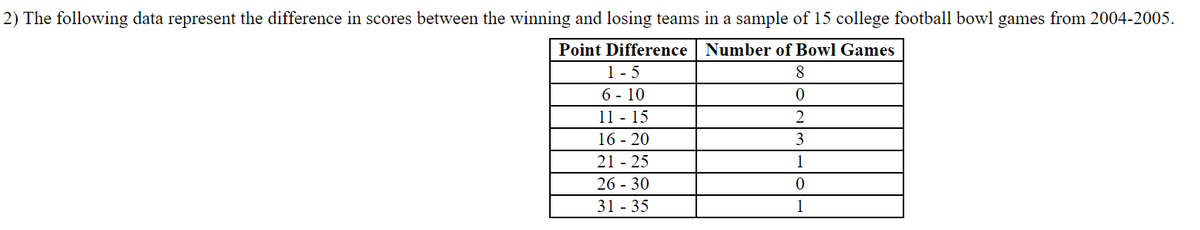
Transcribed Image Text:2) The following data represent the difference in scores between the winning and losing teams in a sample of 15 college football bowl games from 2004-2005.
Point Difference | Number of Bowl Games
1 - 5
6 - 10
11 - 15
16 - 20
21 - 25
8.
2
3
1
26 - 30
31 - 35
1
Expert Solution
This question has been solved!
Explore an expertly crafted, step-by-step solution for a thorough understanding of key concepts.

Step by step
Solved in 2 steps

Recommended textbooks for you
Glencoe Algebra 1, Student Edition, 9780079039897…
Algebra
ISBN:
9780079039897
Author:
Carter
Publisher:
McGraw Hill

Holt Mcdougal Larson Pre-algebra: Student Edition…
Algebra
ISBN:
9780547587776
Author:
HOLT MCDOUGAL
Publisher:
HOLT MCDOUGAL
Glencoe Algebra 1, Student Edition, 9780079039897…
Algebra
ISBN:
9780079039897
Author:
Carter
Publisher:
McGraw Hill
Holt Mcdougal Larson Pre-algebra: Student Edition…
Algebra
ISBN:
9780547587776
Author:
HOLT MCDOUGAL
Publisher:
HOLT MCDOUGAL