2 The time, in minutes, to complete 200 games of chess is shown in the table. Time, x minutes Frequency 20Sx<30 36 30Sx< 40 67 40Sr<50 48 50Sx<60 27 60 Sx<70 10 70Sx<80 80 Sx<90 5 a Draw a histogram to represent this data. b Find the mean, median, QQ, and range, and determine if there are any outliers e Given that the quickest time was 26 minutes and the longest time was 84 minutes, draw a box-and-whisker plot to teoresent shic
2 The time, in minutes, to complete 200 games of chess is shown in the table. Time, x minutes Frequency 20Sx<30 36 30Sx< 40 67 40Sr<50 48 50Sx<60 27 60 Sx<70 10 70Sx<80 80 Sx<90 5 a Draw a histogram to represent this data. b Find the mean, median, QQ, and range, and determine if there are any outliers e Given that the quickest time was 26 minutes and the longest time was 84 minutes, draw a box-and-whisker plot to teoresent shic

Glencoe Algebra 1, Student Edition, 9780079039897, 0079039898, 2018
18th Edition
ISBN:9780079039897
Author:Carter
Publisher:Carter
Chapter10: Statistics
Section10.1: Measures Of Center
Problem 13PPS

Related questions
Question
Please do ques and i will like your answer from 3 ids beleive me but do all the answers typed only without any plagiarism only typed pls typed
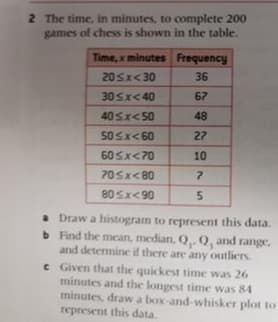
Transcribed Image Text:2 The time, in minutes, to complete 200
games of chess is shown in the table.
Time, x minutes Frequency
20Sx<30
36
30 Sx<40
67
40Sx<50
48
50Sx<60
27
60 Sx<70
10
70Sx<80
80Sx<90
a Draw a histogram to represent this data.
b Find the mean, median, Q..Q, and range,
and determine if there are any outliers
e Given that the quickest time was 26
minutes and the longest time was 84
minutes, drawa box-and-whisker plot to
represent this data.
Expert Solution
This question has been solved!
Explore an expertly crafted, step-by-step solution for a thorough understanding of key concepts.

This is a popular solution!

Trending now
This is a popular solution!

Step by step
Solved in 6 steps with 9 images

Recommended textbooks for you
Glencoe Algebra 1, Student Edition, 9780079039897…
Algebra
ISBN:
9780079039897
Author:
Carter
Publisher:
McGraw Hill
Glencoe Algebra 1, Student Edition, 9780079039897…
Algebra
ISBN:
9780079039897
Author:
Carter
Publisher:
McGraw Hill