2. 7. school keeps a record of drinks purchased from their cafe teria. The cata in the table shcw the purchases for the first eight days of school t roken down into lem on juice and choco rilk purchases. Lemon Juice 25 17 27 21 23 21 16 26 Choco Milk 10 16 9 15 18 19 22 11 . Draw a box-and-v hisker plot for the lemon juice purchases. B. Draw a box-and-v hisker plot for the clhoco milk purchases. C. What is the median for lemon juice purchases? Choco milk purchases? D. How do the data : ets differ? in norenineplhrine (NE)
2. 7. school keeps a record of drinks purchased from their cafe teria. The cata in the table shcw the purchases for the first eight days of school t roken down into lem on juice and choco rilk purchases. Lemon Juice 25 17 27 21 23 21 16 26 Choco Milk 10 16 9 15 18 19 22 11 . Draw a box-and-v hisker plot for the lemon juice purchases. B. Draw a box-and-v hisker plot for the clhoco milk purchases. C. What is the median for lemon juice purchases? Choco milk purchases? D. How do the data : ets differ? in norenineplhrine (NE)

Chapter6: Systems Of Equations And Inequalities
Section: Chapter Questions
Problem 17PS: Cholesterol Cholesterol in human blood is necessary, but too much can lead to health problems. There...

Related questions

Question
Transcribed Image Text:101
Pert II-Mathematics as a Tool CHAPTER 4-Data Manage ment
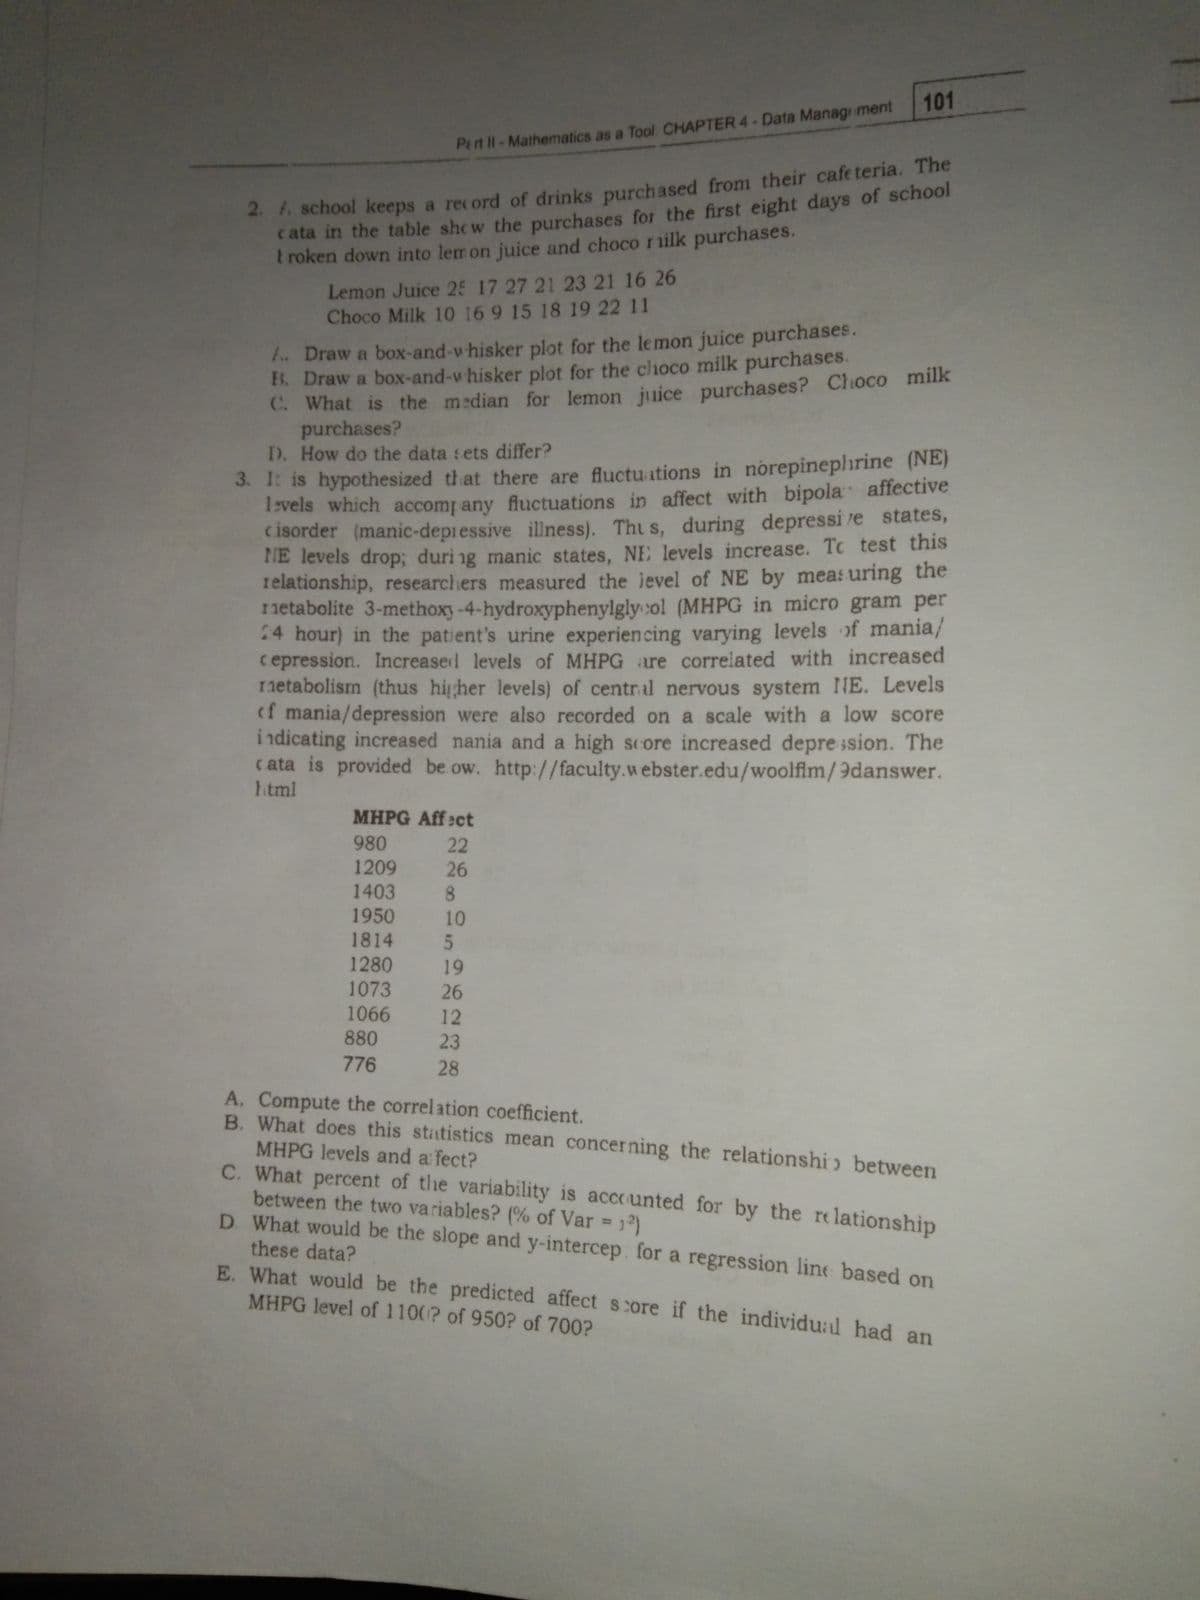
2. . school keeps a record of drinks purchased from their cafe teria. The
cata in the table shcw the purchases for the first eight days of school
t roken down into lem on juice and choco r nilk purchases.
Lemon Juice 25 17 27 21 23 21 16 26
Choco Milk 10 16 9 15 18 19 22 11
. Draw a box-and-v hisker plot for the lemon juice purchases.
EB. Draw a box-and-v hisker plot for the clhoco milk purchases.
C. What is the median for lemon juice purchases? Choco milk
purchases?
D. How do the data sets differ?
3. 1: is hypothesized that there are fluctu ations in norepineplırine (NE)
T5vels which accomp any fluctuations in affect with bipola affective
cisorder (manic-depiessive illness). Thu s, during depressi re states,
HE levels drop; duri ng manic states, NE levels increase. To test this
relationship, researchers measured the level of NE by meas uring the
1netabolite 3-methoxy-4-hydroxyphenylgly ol (MHPG in micro gram per
4 hour) in the patient's urine experiencing varying levels of mania/
cepression. Increased levels of MHPG are correlated with increased
1netabolism (thus higher levels) of central nervous system IHE. Levels
(f mania/depression were also recorded on a scale with a low score
i ndicating increased nania and a high score increased depre ssion. The
cata is provided be ow. http://faculty.webster.edu/woolfim/9danswer.
html
MHPG Affect
980
22
26
1209
1403 8
1950
1814
10
1280
1073
1066
19
26
12
880
23
776
28
A. Compute the correl ation coefficient.
B. What does this statistics mean concerning the relationshi) between
MHPG levels and a fect?
C. What percent of the variability is acccunted for by the relationship
between the two variables? (% of Var = 1?)
D. What would be the slope and y-intercep: for a regression line based on
these data?
E. What would be the predicted affect score if the individual had an
MHPG level of 1100? of 950? of 700?
Expert Solution
This question has been solved!
Explore an expertly crafted, step-by-step solution for a thorough understanding of key concepts.

Step by step
Solved in 4 steps with 4 images

Knowledge Booster


Learn more about
Need a deep-dive on the concept behind this application? Look no further. Learn more about this topic, statistics and related others by exploring similar questions and additional content below.Recommended textbooks for you

Big Ideas Math A Bridge To Success Algebra 1: Stu…
Algebra
ISBN:
9781680331141
Author:
HOUGHTON MIFFLIN HARCOURT
Publisher:
Houghton Mifflin Harcourt

Glencoe Algebra 1, Student Edition, 9780079039897…
Algebra
ISBN:
9780079039897
Author:
Carter
Publisher:
McGraw Hill
Big Ideas Math A Bridge To Success Algebra 1: Stu…
Algebra
ISBN:
9781680331141
Author:
HOUGHTON MIFFLIN HARCOURT
Publisher:
Houghton Mifflin Harcourt
Glencoe Algebra 1, Student Edition, 9780079039897…
Algebra
ISBN:
9780079039897
Author:
Carter
Publisher:
McGraw Hill

Holt Mcdougal Larson Pre-algebra: Student Edition…
Algebra
ISBN:
9780547587776
Author:
HOLT MCDOUGAL
Publisher:
HOLT MCDOUGAL