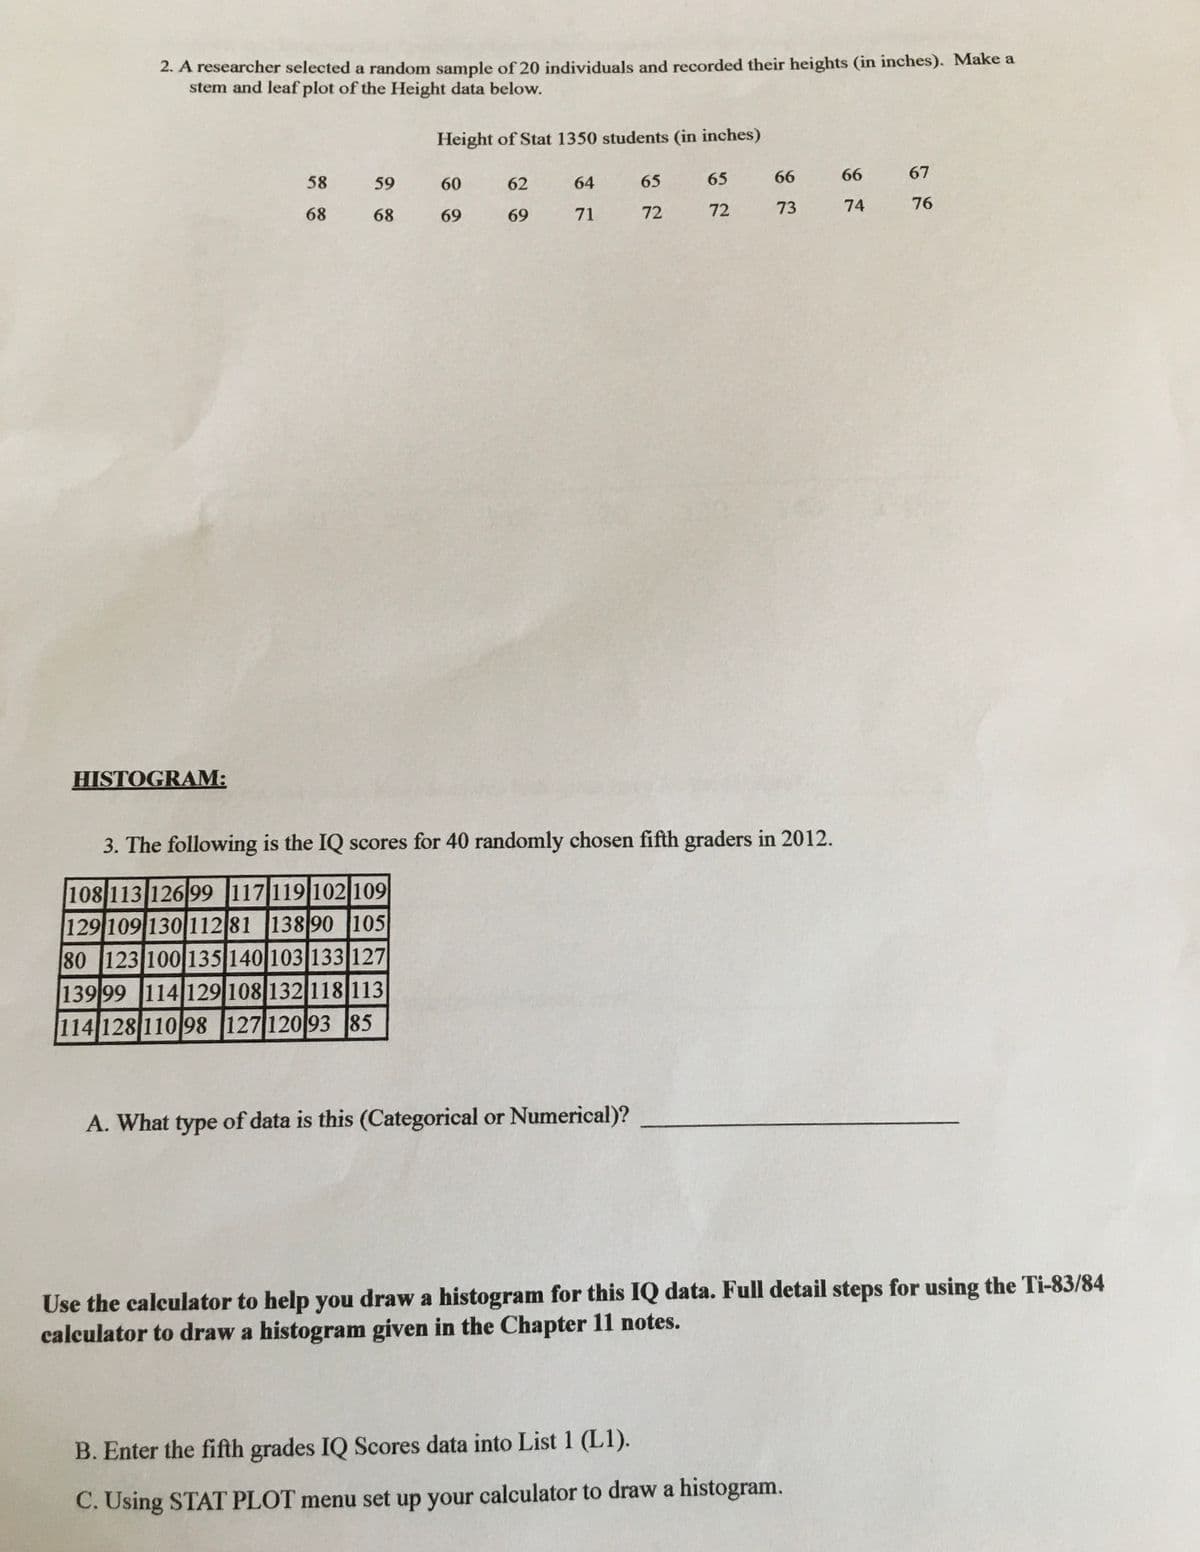
2. A researcher selected a random sample of 20 individuals and recorded their heights (in inches). Make a stem and leaf plot of the Height data below. Height of Stat 1350 students (in inches) 58 64 65 65 66 66 67 59 60 62 68 68 69 71 72 72 73 74 76 69

Glencoe Algebra 1, Student Edition, 9780079039897, 0079039898, 2018
18th Edition
ISBN:9780079039897
Author:Carter
Publisher:Carter
Chapter10: Statistics
Section10.4: Distributions Of Data
Problem 19PFA
icon
Related questions
icon
Concept explainers
Topic Video
Question
2. A researcher selected a random sample of 20 individuals and recorded their heights (in inches). Make a
stem and leaf plot of the Height data below.
Height of Stat 1350 students (in inches)
58
59
60
62
64
65
65
66
66
67
68
68
69
69
71
72
72
73
74
76
HISTOGRAM:
3. The following is the IQ scores for 40 randomly chosen fifth graders in 2012.
108 113 12699 117 119 102 109
129 109 130 112 81 138 90 105
80 123 100 135 140 103 133 127
139 99 114 129 108 132 118 113
114 128 110 98 127 120 93 85
A. What type of data is this (Categorical or Numerical)?
Use the calculator to help you draw a histogram for this IQ data. Full detail steps for using the Ti-83/84
calculator to draw a histogram given in the Chapter 11 notes.
B. Enter the fifth grades IQ Scores data into List1 (L1).
C. Using STAT PLOT menu set up your calculator to draw a histogram.
Transcribed Image Text:2. A researcher selected a random sample of 20 individuals and recorded their heights (in inches). Make a stem and leaf plot of the Height data below. Height of Stat 1350 students (in inches) 58 59 60 62 64 65 65 66 66 67 68 68 69 69 71 72 72 73 74 76 HISTOGRAM: 3. The following is the IQ scores for 40 randomly chosen fifth graders in 2012. 108 113 12699 117 119 102 109 129 109 130 112 81 138 90 105 80 123 100 135 140 103 133 127 139 99 114 129 108 132 118 113 114 128 110 98 127 120 93 85 A. What type of data is this (Categorical or Numerical)? Use the calculator to help you draw a histogram for this IQ data. Full detail steps for using the Ti-83/84 calculator to draw a histogram given in the Chapter 11 notes. B. Enter the fifth grades IQ Scores data into List1 (L1). C. Using STAT PLOT menu set up your calculator to draw a histogram.
Expert Solution
trending now

Trending now

This is a popular solution!

steps

Step by step

Solved in 2 steps

Blurred answer
Knowledge Booster
Centre, Spread, and Shape of a Distribution
Learn more about
Need a deep-dive on the concept behind this application? Look no further. Learn more about this topic, statistics and related others by exploring similar questions and additional content below.
Recommended textbooks for you
Glencoe Algebra 1, Student Edition, 9780079039897…
Algebra
ISBN:
9780079039897
Author:
Carter
Publisher:
McGraw Hill