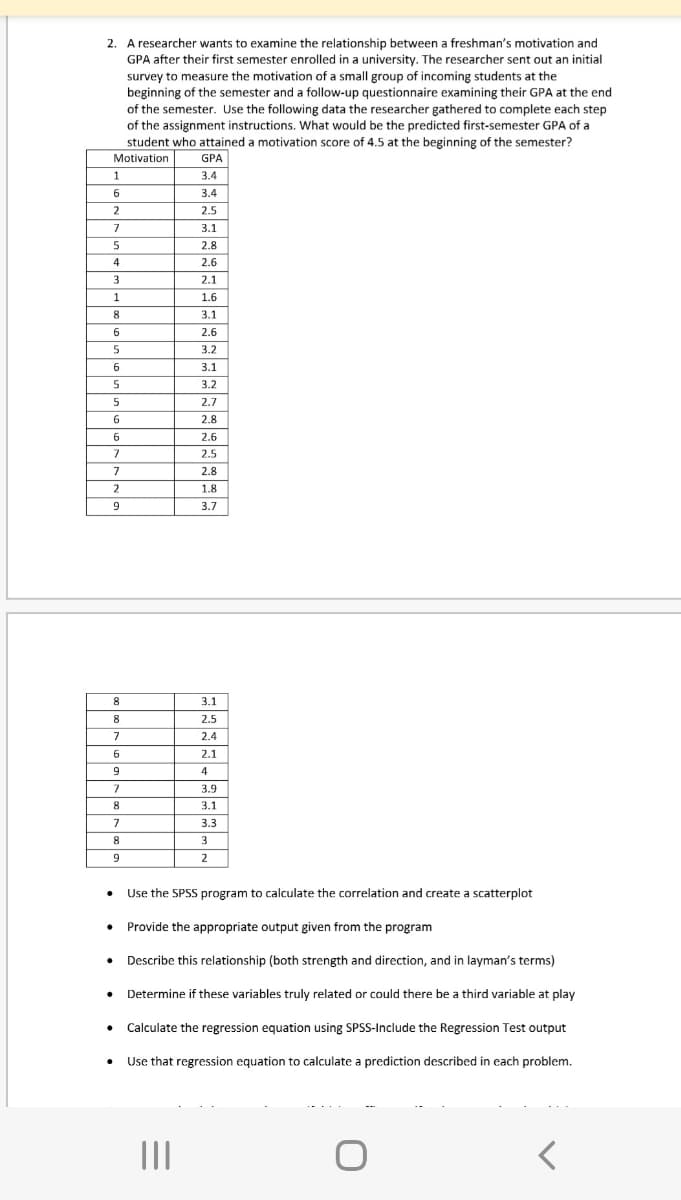
2. A researcher wants to examine the relationship between a freshman's motivation and GPA after their first semester enrolled in a university. The researcher sent out an initial survey to measure the motivation of a small group of incoming students at the beginning of the semester and a follow-up questionnaire examining their GPA at the end of the semester. Use the following data the researcher gathered to complete each step of the assignment instructions. What would be the predicted first-semester GPA of a student who attained a motivation score of 4.5 at the beginning of the semester? Motivation GPA 3.4 3.4 2.5 1 6 2
2. A researcher wants to examine the relationship between a freshman's motivation and GPA after their first semester enrolled in a university. The researcher sent out an initial survey to measure the motivation of a small group of incoming students at the beginning of the semester and a follow-up questionnaire examining their GPA at the end of the semester. Use the following data the researcher gathered to complete each step of the assignment instructions. What would be the predicted first-semester GPA of a student who attained a motivation score of 4.5 at the beginning of the semester? Motivation GPA 3.4 3.4 2.5 1 6 2

Glencoe Algebra 1, Student Edition, 9780079039897, 0079039898, 2018
18th Edition
ISBN:9780079039897
Author:Carter
Publisher:Carter
Chapter10: Statistics
Section10.6: Summarizing Categorical Data
Problem 27PPS

Related questions
Question
Transcribed Image Text:2. A researcher wants to examine the relationship between a freshman's motivation and
GPA after their first semester enrolled in a university. The researcher sent out an initial
survey to measure the motivation of a small group of incoming students at the
beginning of the semester and a follow-up questionnaire examining their GPA at the end
of the semester. Use the following data the researcher gathered to complete each step
of the assignment instructions. What would be the predicted first-semester GPA of a
student who attained a motivation score of 4.5 at the beginning of the semester?
Motivation
GPA
1
6
2
7
5
4
3
1
8
6
5
6
5
5
6
6
7
7
2
9
8
8
7
6
9
7
8
7
8
9
●
3.4
3.4
2.5
3.1
2.8
2.6
.
2.1
1.6
3.1
2.6
3.2
3.1
3.2
.
2.7
2.8
2.6
2.5
|||
2.8
1.8
3.7
3.1
2.5
2.4
2.1
4
3.9
3.1
● Provide the appropriate output given from the program
3.3
3
2
Use the SPSS program to calculate the correlation and create a scatterplot
. Describe this relationship (both strength and direction, and in layman's terms)
Determine if these variables truly related or could there be a third variable at play
• Calculate the regression equation using SPSS-Include the Regression Test output
Use that regression equation to calculate a prediction described in each problem.
O
<
Expert Solution
This question has been solved!
Explore an expertly crafted, step-by-step solution for a thorough understanding of key concepts.

This is a popular solution!

Trending now
This is a popular solution!

Step by step
Solved in 4 steps with 3 images

Recommended textbooks for you
Glencoe Algebra 1, Student Edition, 9780079039897…
Algebra
ISBN:
9780079039897
Author:
Carter
Publisher:
McGraw Hill
Glencoe Algebra 1, Student Edition, 9780079039897…
Algebra
ISBN:
9780079039897
Author:
Carter
Publisher:
McGraw Hill