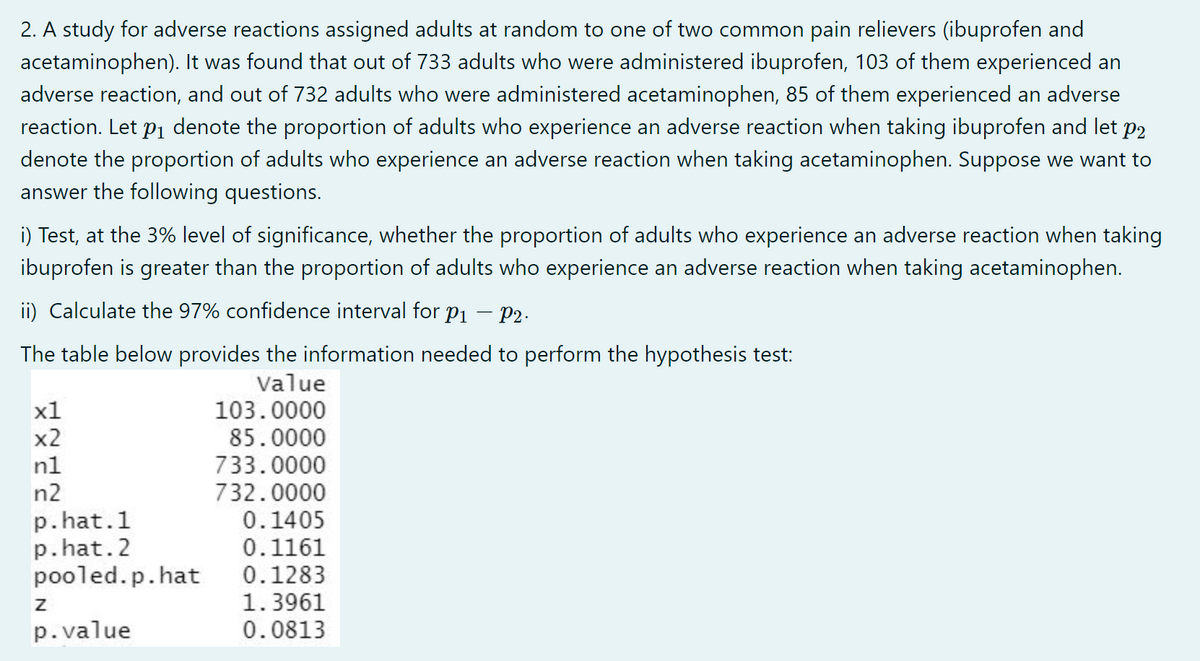
2. A study for adverse reactions assigned adults at random to one of two common pain relievers (ibuprofen and acetaminophen). It was found that out of 733 adults who were administered ibuprofen, 103 of them experienced an adverse reaction, and out of 732 adults who were administered acetaminophen, 85 of them experienced an adverse reaction. Let pi denote the proportion of adults who experience an adverse reaction when taking ibuprofen and let denote the proportion of adults who experience an adverse reaction when taking acetaminophen. Suppose we want to answer the following questions. P2 i) Test, at the 3% level of significance, whether the proportion of adults who experience an adverse reaction when taking ibuprofen is greater than the proportion of adults who experience an adverse reaction when taking acetaminophen. ii) Calculate the 97% confidence interval for pi – P2- The table below provides the information needed to perform the hypothesis test: Value 103.0000 х1 x2 85.0000 733.0000 732.0000 0.1405 n1 n2 p.hat.1 p.hat.2 pooled.p.hat 0.1161 0.1283 1.3961 p.value 0.0813
2. A study for adverse reactions assigned adults at random to one of two common pain relievers (ibuprofen and acetaminophen). It was found that out of 733 adults who were administered ibuprofen, 103 of them experienced an adverse reaction, and out of 732 adults who were administered acetaminophen, 85 of them experienced an adverse reaction. Let pi denote the proportion of adults who experience an adverse reaction when taking ibuprofen and let denote the proportion of adults who experience an adverse reaction when taking acetaminophen. Suppose we want to answer the following questions. P2 i) Test, at the 3% level of significance, whether the proportion of adults who experience an adverse reaction when taking ibuprofen is greater than the proportion of adults who experience an adverse reaction when taking acetaminophen. ii) Calculate the 97% confidence interval for pi – P2- The table below provides the information needed to perform the hypothesis test: Value 103.0000 х1 x2 85.0000 733.0000 732.0000 0.1405 n1 n2 p.hat.1 p.hat.2 pooled.p.hat 0.1161 0.1283 1.3961 p.value 0.0813

Holt Mcdougal Larson Pre-algebra: Student Edition 2012
1st Edition
ISBN:9780547587776
Author:HOLT MCDOUGAL
Publisher:HOLT MCDOUGAL
Chapter11: Data Analysis And Probability
Section: Chapter Questions
Problem 8CR

Related questions
Question
Transcribed Image Text:2. A study for adverse reactions assigned adults at random to one of two common pain relievers (ibuprofen and
acetaminophen). It was found that out of 733 adults who were administered ibuprofen, 103 of them experienced an
adverse reaction, and out of 732 adults who were administered acetaminophen, 85 of them experienced an adverse
reaction. Let p1 denote the proportion of adults who experience an adverse reaction when taking ibuprofen and let p2
denote the proportion of adults who experience an adverse reaction when taking acetaminophen. Suppose we want to
answer the following questions.
i) Test, at the 3% level of significance, whether the proportion of adults who experience an adverse reaction when taking
ibuprofen is greater than the proportion of adults who experience an adverse reaction when taking acetaminophen.
ii) Calculate the 97% confidence interval for p1
- P2.
The table below provides the information needed to perform the hypothesis test:
Value
x1
103.0000
85.0000
733.0000
732.0000
0.1405
0.1161
0.1283
1.3961
0.0813
x2
n1
n2
p.hat.1
p. hat.2
pooled.p.hat
p.value
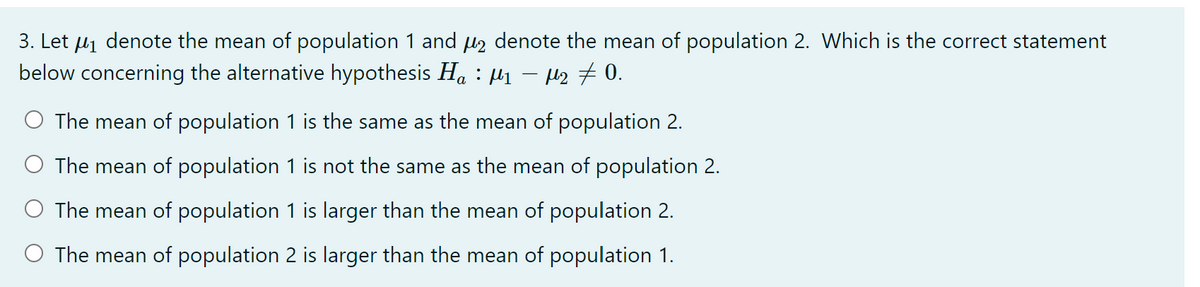
Transcribed Image Text:3. Let uj denote the mean of population 1 and u denote the mean of population 2. Which is the correct statement
below concerning the alternative hypothesis H. : µ1 – H2 #0.
The mean of population 1 is the same as the mean of population 2.
The mean of population 1 is not the same as the mean of population 2.
O The mean of population 1 is larger than the mean of population 2.
O The mean of population 2 is larger than the mean of population 1.
Expert Solution
This question has been solved!
Explore an expertly crafted, step-by-step solution for a thorough understanding of key concepts.

Step by step
Solved in 3 steps

Recommended textbooks for you
Holt Mcdougal Larson Pre-algebra: Student Edition…
Algebra
ISBN:
9780547587776
Author:
HOLT MCDOUGAL
Publisher:
HOLT MCDOUGAL
Holt Mcdougal Larson Pre-algebra: Student Edition…
Algebra
ISBN:
9780547587776
Author:
HOLT MCDOUGAL
Publisher:
HOLT MCDOUGAL