2. Based on the R output, there is a linear relationship between recorded cemperature and death toll among bats. O A. very weak direct B. very weak inverse
2. Based on the R output, there is a linear relationship between recorded cemperature and death toll among bats. O A. very weak direct B. very weak inverse

Algebra & Trigonometry with Analytic Geometry
13th Edition
ISBN:9781133382119
Author:Swokowski
Publisher:Swokowski
Chapter6: The Trigonometric Functions
Section6.7: Applied Problems
Problem 18E

Related questions
Question
2
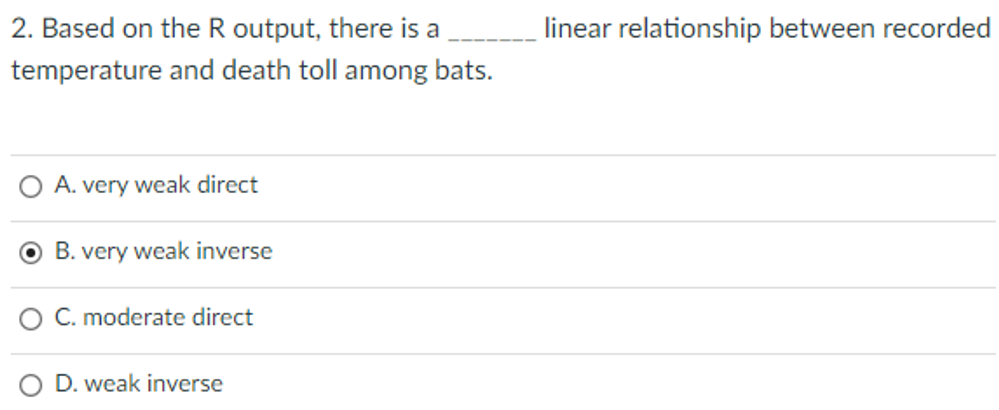
Transcribed Image Text:2. Based on the R output, there is a
linear relationship between recorded
temperature and death toll among bats.
O A. very weak direct
O B. very weak inverse
O C. moderate direct
D. weak inverse
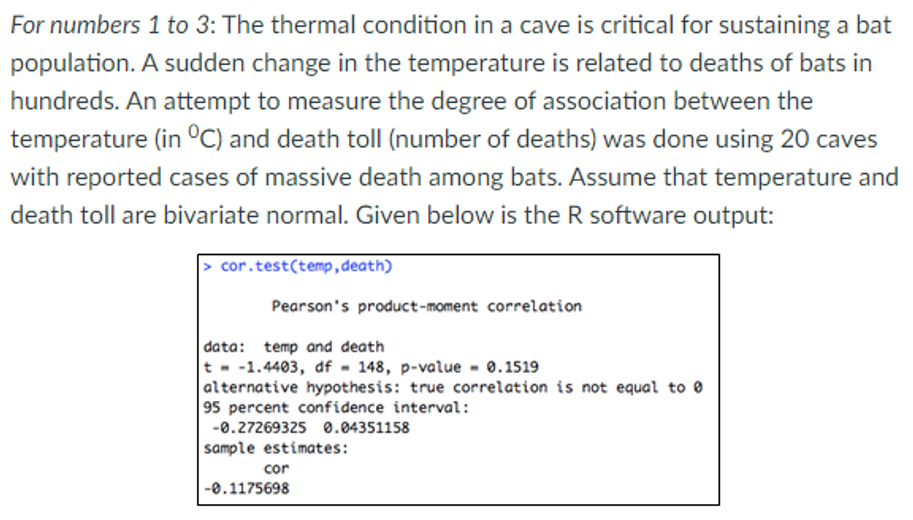
Transcribed Image Text:For numbers 1 to 3: The thermal condition in a cave is critical for sustaining a bat
population. A sudden change in the temperature is related to deaths of bats in
hundreds. An attempt to measure the degree of association between the
temperature (in °C) and death toll (number of deaths) was done using 20 caves
with reported cases of massive death among bats. Assume that temperature and
death toll are bivariate normal. Given below is the R software output:
cor.test(temp,death)
Pearson's product-moment correlation
data: temp and death
t - -1.4403, df - 148, p-value - 0.1519
|alternative hypothesis: true correlation is not equal to 0
95 percent confidence interval:
-0.27269325 0.04351158
sample estimates:
cor
-0.1175698
Expert Solution
This question has been solved!
Explore an expertly crafted, step-by-step solution for a thorough understanding of key concepts.

Step by step
Solved in 2 steps

Recommended textbooks for you
Algebra & Trigonometry with Analytic Geometry
Algebra
ISBN:
9781133382119
Author:
Swokowski
Publisher:
Cengage

Trigonometry (MindTap Course List)
Trigonometry
ISBN:
9781337278461
Author:
Ron Larson
Publisher:
Cengage Learning
Algebra & Trigonometry with Analytic Geometry
Algebra
ISBN:
9781133382119
Author:
Swokowski
Publisher:
Cengage
Trigonometry (MindTap Course List)
Trigonometry
ISBN:
9781337278461
Author:
Ron Larson
Publisher:
Cengage Learning