2. Calculating marginal revenue from a linear demand curve The blue curve on the following graph represents the demand curve facing a firm that can set its own prices. Use the graph input tool to help you answer the following questions. You will not be graded on any changes you make to this graph. Note: Once you enter a value in a white field, the graph and any corresponding amounts in each grey field will change accordingly. Graph Input Tool (?) Market for Goods 200 180 IQuantity 20 Demanded (Units) 160 Demand Price (Dollars per unit) 140 100.00 9 120 100 80 60 Demand 40 20 8 12 16 20 24 28 32 36 40 QUANTITY (Units) On the graph input tool, change the number found in the Quantity Demanded field to determine the prices that correspond to the production of 0, 8, 16, 20, 24, 32, and 40 units of output. Calculate the total revenue for each of these production levels. Then, on the following graph, use the green points (triangle symbol) to plot the results. 2000 1800 Total Revenue 1600 1400 1200 1000 800 600 400 200 4 8 12 16 20 24 28 32 36 40 QUANTITY (Number of units) TOTAL REVENUE (Dollars) PRICE (Dollars per unit)
2. Calculating marginal revenue from a linear demand curve The blue curve on the following graph represents the demand curve facing a firm that can set its own prices. Use the graph input tool to help you answer the following questions. You will not be graded on any changes you make to this graph. Note: Once you enter a value in a white field, the graph and any corresponding amounts in each grey field will change accordingly. Graph Input Tool (?) Market for Goods 200 180 IQuantity 20 Demanded (Units) 160 Demand Price (Dollars per unit) 140 100.00 9 120 100 80 60 Demand 40 20 8 12 16 20 24 28 32 36 40 QUANTITY (Units) On the graph input tool, change the number found in the Quantity Demanded field to determine the prices that correspond to the production of 0, 8, 16, 20, 24, 32, and 40 units of output. Calculate the total revenue for each of these production levels. Then, on the following graph, use the green points (triangle symbol) to plot the results. 2000 1800 Total Revenue 1600 1400 1200 1000 800 600 400 200 4 8 12 16 20 24 28 32 36 40 QUANTITY (Number of units) TOTAL REVENUE (Dollars) PRICE (Dollars per unit)

Chapter8: Perfect Competition
Section: Chapter Questions
Problem 7.15P

Related questions
Question
Below screenshots are one question. It was rejected because it was not a clear so I took 2 creenshots
Transcribed Image Text:2. Calculating marginal revenue from a linear demand curve
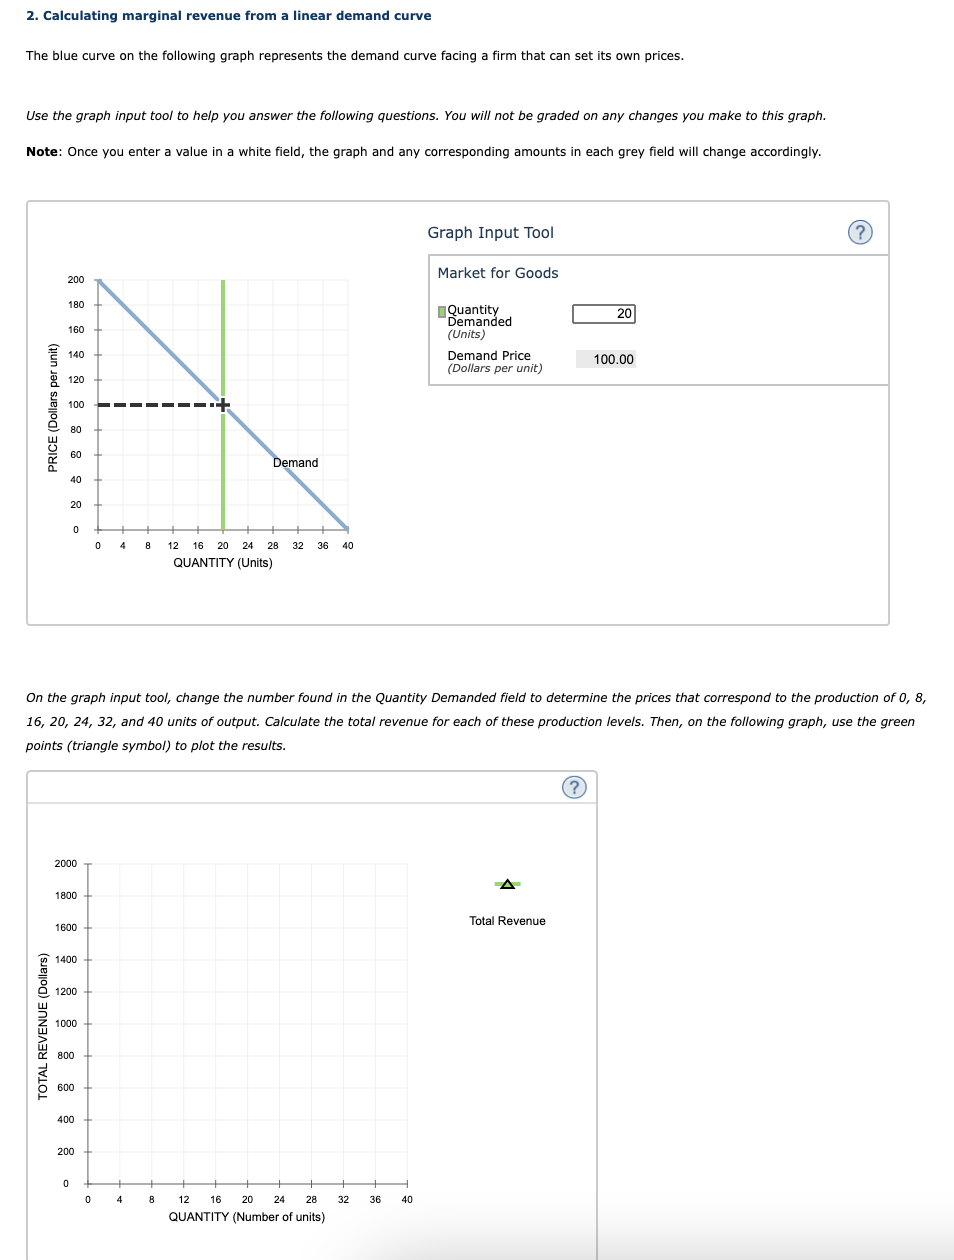
The blue curve on the following graph represents the demand curve facing a firm that can set its own prices.
Use the graph input tool to help you answer the following questions. You will not be graded on any changes you make to this graph.
Note: Once you enter a value in a white field, the graph and any corresponding amounts in each grey field will change accordingly.
Graph Input Tool
(?)
Market for Goods
200
180
IQuantity
20
Demanded
(Units)
160
Demand Price
(Dollars per unit)
140
100.00
9 120
100
80
60
Demand
40
20
8
12
16
20
24 28 32
36
40
QUANTITY (Units)
On the graph input tool, change the number found in the Quantity Demanded field to determine the prices that correspond to the production of 0, 8,
16, 20, 24, 32, and 40 units of output. Calculate the total revenue for each of these production levels. Then, on the following graph, use the green
points (triangle symbol) to plot the results.
2000
1800
Total Revenue
1600
1400
1200
1000
800
600
400
200
4
8
12
16
20
24
28
32
36
40
QUANTITY (Number of units)
TOTAL REVENUE (Dollars)
PRICE (Dollars per unit)
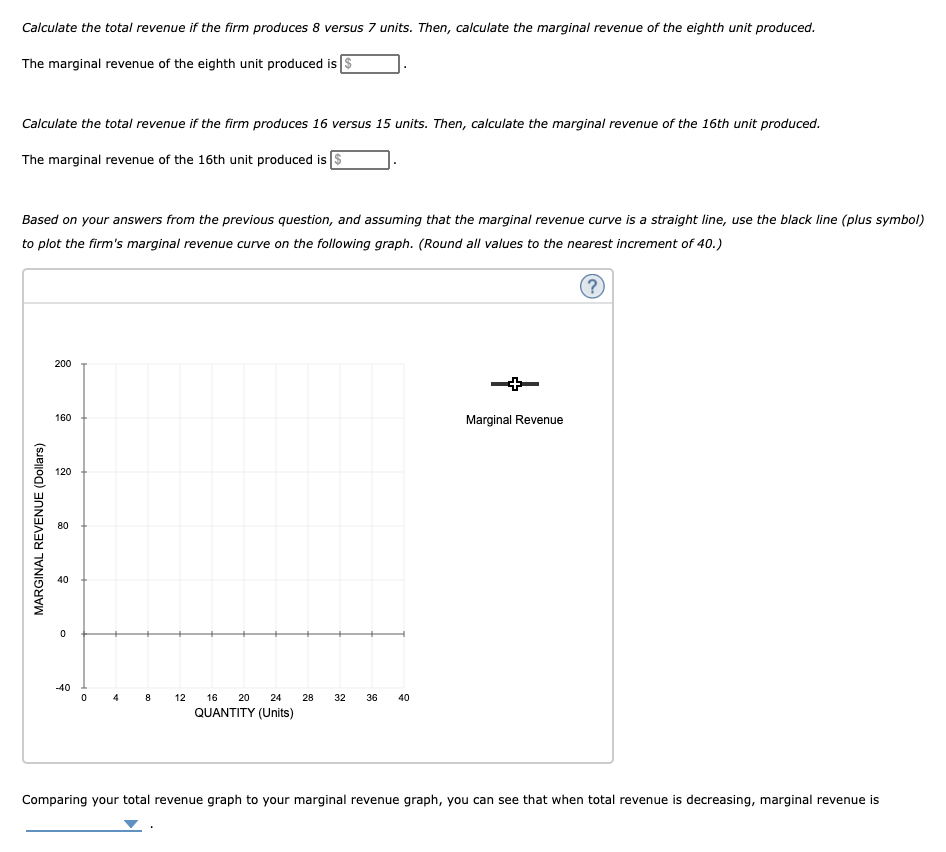
Transcribed Image Text:Calculate the total revenue if the firm produces 8 versus 7 units. Then, calculate the marginal revenue of the eighth unit produced.
The marginal revenue of the eighth unit produced is S
Calculate the total revenue if the firm produces 16 versus 15 units. Then, calculate the marginal revenue of the 16th unit produced.
The marginal revenue of the 16th unit produced is S
Based on your answers from the previous question, and assuming that the marginal revenue curve is a straight line, use the black line (plus symbol)
to plot the firm's marginal revenue curve on the following graph. (Round all values to the nearest increment of 40.)
200
160
Marginal Revenue
120
80
40
-40
4
8
12
16
20
24
28
32
36
40
QUANTITY (Units)
Comparing your total revenue graph to your marginal revenue graph, you can see that when total revenue is decreasing, marginal revenue is
MARGINAL REVENUE (Dollars)
Expert Solution
This question has been solved!
Explore an expertly crafted, step-by-step solution for a thorough understanding of key concepts.

This is a popular solution!

Trending now
This is a popular solution!

Step by step
Solved in 2 steps with 2 images

Knowledge Booster


Learn more about
Need a deep-dive on the concept behind this application? Look no further. Learn more about this topic, economics and related others by exploring similar questions and additional content below.Recommended textbooks for you

Principles of Economics, 7th Edition (MindTap Cou…
Economics
ISBN:
9781285165875
Author:
N. Gregory Mankiw
Publisher:
Cengage Learning

Essentials of Economics (MindTap Course List)
Economics
ISBN:
9781337091992
Author:
N. Gregory Mankiw
Publisher:
Cengage Learning
Principles of Economics, 7th Edition (MindTap Cou…
Economics
ISBN:
9781285165875
Author:
N. Gregory Mankiw
Publisher:
Cengage Learning
Essentials of Economics (MindTap Course List)
Economics
ISBN:
9781337091992
Author:
N. Gregory Mankiw
Publisher:
Cengage Learning

Principles of Microeconomics (MindTap Course List)
Economics
ISBN:
9781305971493
Author:
N. Gregory Mankiw
Publisher:
Cengage Learning

Principles of Economics (MindTap Course List)
Economics
ISBN:
9781305585126
Author:
N. Gregory Mankiw
Publisher:
Cengage Learning

Principles of Microeconomics
Economics
ISBN:
9781305156050
Author:
N. Gregory Mankiw
Publisher:
Cengage Learning