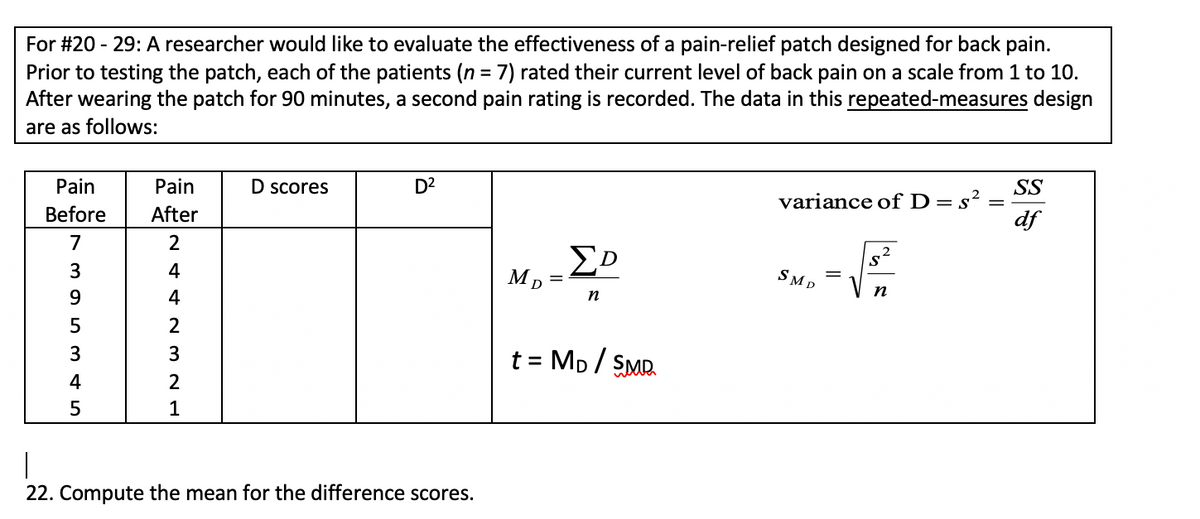
2. Compute the mean for the difference scores.


Q: Find the mean: Find the median: Find the standard deviation:
A: We have to calculate the mean, median and standard deviation of given data. First we have to sort…
Q: A tire company claims that their new tires will have an average life of 122000 miles. A consumer…
A:
Q: 2) A 95% confidence interval estimate for a population mean µ is (23, 45). Which of the following is…
A: As per our guidelines we are supposed to answer only one question per post so i am solving first…
Q: Is college worth it?: A poll was conducted to determine why Americans decide not to go to college.…
A: Given that Sample size n =322 Sample proportion p^=0.46
Q: Answer the following question. Draw the curve and solve for the unknown. 1. To help students improve…
A: Note: According to Bartleby guidelines expert solve only one question and rest can be reposted.…
Q: A bag contains 3 white, 4 black and 5 red balls. Three balls are dra random one after another…
A:
Q: A couple plans to have children until they have a girl. Suppose that they set no limit on the number…
A: Number of repetitions = 25 Probability of being a girl ,p= 0.49 Probability of being a boy, q = 0.51…
Q: 4. What percent of light bulbs will last less than 770 hours?
A:
Q: Variable N Mean SE Mean StDev Variance 20 50.184 ? 1.816 ?
A: A computer software package calculated in which N=20 StDev=1.816
Q: What does it mean if we say that our hypothesis test has a two-sided (or, as it’s sometimes called,…
A: Two-sided or two-tailed hypothesis test
Q: 3. If U and V are such that u; ='x; – A, v; =y, - B, then Cov (U, V) is :
A:
Q: Find the probability of getting 6 and 5 respectively in two throws of a die.
A:
Q: Let X1, X2, ..., X, denote a random sample from the normal distribution with mean u and variance o?.…
A:
Q: Suppose I want to test whether the judges from a contestant's country rate their own contestant…
A: The objective is to find out which is the best experiment design to investigate whether the judges…
Q: Answer questions 2-5 dealing with the life expectancy of light bulbs whose lifetimes are normally…
A: Assume, X be the random variable representing the life expectancy (in hours) of light bulbs. It is…
Q: Two-Way Classification Designs An experiment was designed to test the effects of five levels of…
A: 1. From the given information, L1 L2 L3 L4 L5 P1 63.3 55.8 62.9 63.8 70.9 P2 62.3 68.7…
Q: Solar earned a score of 940 on a national achievement test. The mean test score was 850 wth a…
A: Given that Solar earned a score of 940. The test scores are normally distributed. Mean test score…
Q: deviation s = 0.1. Is there sufficient evidence in the sample to suggest that the mean nicotine…
A: here given, sample mean = 1.53 sample standard deviation = s= 0.1 significance level = 0.01
Q: Given the following data for an imaginary superhero universe: Flying Telepathy Super Strength Female…
A: From the provided information, Flying Telepathy Super Strength Total Female 96…
Q: Use the currency exchange rates in the table for the following question. Dollars per Foreign 1.414…
A: Given that
Q: The article “The Selection of Yeast Strains for the Production of Premium Quality South African…
A:
Q: Scatter Diagrams and High-Low Cost Estimation From April 1 through October 31, Will County Highway…
A:
Q: You are conducting a hypothesis test about body temperature where the null hypothesis is that mu is…
A: Given that Null hypothesis H0 : μ≤98.6 Alternative hypothesis H1 : μ>98.6 Hypothesized…
Q: Use the following scenario to conduct a hypothesis test. You will again go through the different…
A: Given: p = 0.58 x = 364 n = 682 α = 0.05
Q: One option in a roulette game is the bat one dollar on red there are 18 red compartments 18 black…
A: The probability distribution is: Outcome Prize (x) Probability (p) Red $2 18/38 Not Red -$1…
Q: Illustration 16.68. A number x is chosen at random from the inte- gers 1, 2, 3, of 3 and 4,…
A:
Q: We’ll say that a permutation T = (T(1),.….., T(n)) contains a swap if there exist i, je{1,..,n} so…
A: a) Let we take n > 1. Let Xi be a random variable if i is a partner in a swap or not. The values…
Q: Find the specified probability. Round your answer to four decimal places, if necessary.…
A: Answer :- P(−1.55 < z < 0) = 0.4394 Explaination is given in the next step.
Q: 4. To estimate the mean retail price of designer jeans, a buyer sampled 19 retailers in New York…
A:
Q: question 6
A: Given
Q: year Calculate the mode.
A: We have given that the data represent the number of paid public holidays per year from selected 9…
Q: What is the point estimate of the population mean? What is the point estimate of the population…
A: We have given that the data from the normal population. Note: According to Bartleby expert…
Q: An article in Air and Waste [“Update on Ozone Trends in California's South Coast Air Basin" (Vol.…
A: 8) Adequacy of the regression model is checked by using the three methods: By using normal plot By…
Q: 5. Use the following table to answer the questions asked. Rel. Freq. Cum Rel.Freg Score Frequency 89…
A: We have give the following table Note: According to Bartleby expert guidelines, we can answer only…
Q: 41. In statistical notation, which of the following is the correct null hypothesis for an…
A: We have given that, In statistical notation, which of the following is the correct null hypothesis…
Q: The St. Lucian Government is interested in predicting the number of weekly riders on the public…
A: Given information: City Number of weekly riders Price per week Population of city Monthly income…
Q: Could please help interpret this SPSS output of a paired sample t-test?
A: Inferential statistics is one of the broad classification of statistics. In this method, some…
Q: The average systolic blood pressure of a population of young men is µ = 112.5 mm, o = 16.4 mm.…
A:
Q: TEST YOURSELF: Solve for the mean, median, and mode of the given distribution. SHOW YOUR SOLUTION ON…
A: The given data is,
Q: The number (in hundreds) of letter posted in a certain city on each day in a typical period of five…
A:
Q: ou are conducting a hypothesis test where alternative (research) hypothesis is that mu is greater…
A:
Q: Illustration 16.68. A number x is chosen at random from the inte- n and A andB denotes the events…
A:
Q: A study shows that the normal time that a customer occupied a table in a fine dine restaurant is 1.2…
A:
Q: 70, 11). Suppose that you form random samples of 25 from this distribution. Let X be the random…
A: Given n=25, population mean μ=70, standard deviations σ=11 Note: This probability value calculated…
Q: (Problems 6-10) An investigator polls a representative sample of common cold sufferers, asking them…
A: Given Population mean μ=83, standard deviations σ=20
Q: The following question is from Interpreting Basic Statistics by Holcomb 8th edition: - How many…
A: Given Theoretical question
Q: ow much will person pay for 4.5 pounds of bananas at a price of 2.29 per pound?
A: Given data, One pound of banana costs 2.29 How much will person pay for 4.5 pounds of bananas?
Q: Show that the power function of the sign test is non-increasing for the hypotheses Ho : 0 = 00 H1 :…
A: Given Information: The sign test is used to compare the size of the two groups. The sign test is a…
Q: Lindsay is 25 years old and has a new job in web development. She wants to make sure that she is…
A: Since you have asked multiple questions, we will solve the first question for you. If you want any…
Q: 3. A packaging system fills boxes to an average weight of 15 ounces with a standard deviation of 0.5…
A: Given Population mean μ=15, standard deviations σ=0.5
22

Step by step
Solved in 2 steps

- For the following exercises, consider this scenario: The population of a city increased steadily overa ten-year span. The following ordered pairs show the population and the year over the ten-year span (population, year) for specific recorded years: (3,600,2000);(4,000,2001);(4,700,2003);(6,000,2006) 44. What is the correlation coefficient for this model tothree decimal places of accuracy?A study conducted by students in an AP Psychologyclass at South Kent School in Connecticut discovereda correlation of –0.38 between hours of sleep (x) andGPA (y). If we change the variable on the horizontal axisto hours awake (24 - x), but make no change to theGPA data, which of the following would be true aboutthe new scatterplot?A) It slopes down, and the correlation is -0.38.B) It slopes down, and the correlation is +0.38.C) It slopes up, and the correlation is -0.38.D) It slopes up, and the correlation is +0.38.E) None of the above choices is correct.(Source: http://www.cardinalnewsnetwork.org/south-kent-community/sleep-study-sks-style/)X Y 1 6 4 1 1 4 1 3 3 1 Which of the following scatterplots accurately depicts this set of scores?
- Given that SSxx=265, SSyy=172, and SSxy=184, What is the value of the correlation coefficient?A set of n = 10 pairs of scores has ΣX = 20, ΣY = 30, and ΣXY = 74. What is the value of SP for these data?Given that SSxx=213, SSyy=176, and SSxy=180, What is the value of the correlation coefficient? (Round to two decimal places).
- for a population with a µ = 60 and σ = 12 Find the z-score for an x value of 75For each of the following statements, indicate whether you believe the statement is true or false. If you correlate two quantitative variables, called “x” and “y,” the correlation will not change if you switch which variable is “x” and which is “y.” To compute r, both variables must be quantitative (or numerical). The correlation coefficient is not affected by outliers.If r = 0.5 and N = 4, would you conclude that a positive correlationexists between the two variables? Explain your answer. Whatif N = 500?
- For each problem, select the best response. (a) In a scatterplot of the average price of a barrel of oil and the average retail price of a gallon of gasoline, you expect to see A. a positive association. B. very little association. C. a negative association. D. None of the above. (b) If the correlation between two variables is close to 0, you can conclude that a scatterplot would show A. a cloud of points with no visible pattern.B. no straight-line pattern, but there might be a strong pattern of another form. C. a strong straight-line pattern. D. None of the above. (c) You have data for many years on the average price of a barrel of oil and the average retail price of a gallon of unleaded regular gasoline. When you make a scatterplot, the explanatory variable on the x -axis A. is the price of gasoline. B. can be either oil price or gasoline price. C. is the price of oil. D. None of the above.For a population with μ =100 and σ = 20, what is the X value corresponding to z = -0.50?In general, ___________% of the values in a data set lie at or below the 28 th percentile. _______________ % of the values in a data set lie at or above the 90 th percentile.. If a sample consists of 700 test scores, _________of them would be at or below the 52 th percentile. If a sample consists of 700 test scores, ________ of them would be at or above the 64 th percentile.