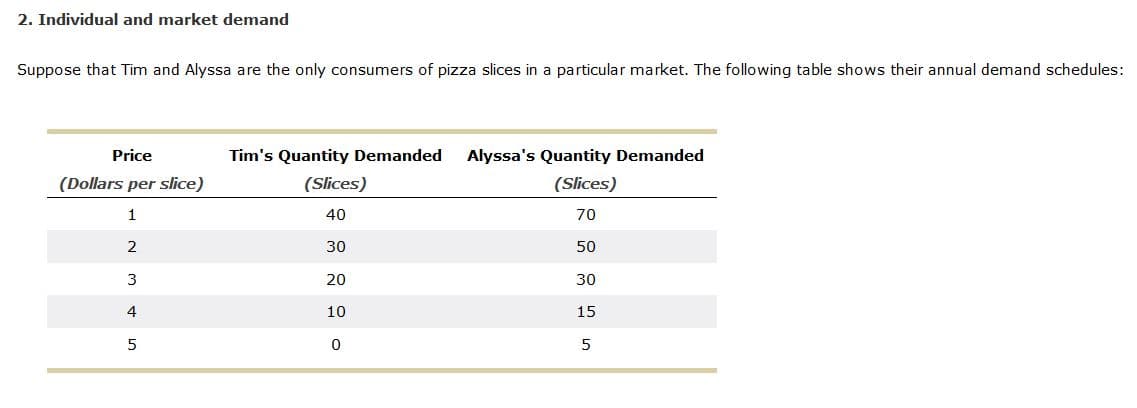
2. Individual and market demand Suppose that Tim and Alyssa are the only consumers of pizza slices in a particular market. The following table shows their annual demand schedules: Price Tim's Quantity Demanded Alyssa's Quantity Demanded (Dollars per slice) (Slices) 40 (Slices) 70 2 30 50 3 20 30 4 15 10 On the following graph, plot Tim's demand for pizza slices using the green points (triangle symbol). Next, plot Alyssa's demand for pizza slices using the purple points (diamond symbol). Finally, plot the market demand for pizza slices using the blue points (circle symbol). Tim's Demand Alyssa's Demand Market Demand 1 20 40 60 80 100 120 QUANTITY (Slices) PRICE (Dollars per slice) 2.
2. Individual and market demand Suppose that Tim and Alyssa are the only consumers of pizza slices in a particular market. The following table shows their annual demand schedules: Price Tim's Quantity Demanded Alyssa's Quantity Demanded (Dollars per slice) (Slices) 40 (Slices) 70 2 30 50 3 20 30 4 15 10 On the following graph, plot Tim's demand for pizza slices using the green points (triangle symbol). Next, plot Alyssa's demand for pizza slices using the purple points (diamond symbol). Finally, plot the market demand for pizza slices using the blue points (circle symbol). Tim's Demand Alyssa's Demand Market Demand 1 20 40 60 80 100 120 QUANTITY (Slices) PRICE (Dollars per slice) 2.

Principles of Economics 2e
2nd Edition
ISBN:9781947172364
Author:Steven A. Greenlaw; David Shapiro
Publisher:Steven A. Greenlaw; David Shapiro
Chapter6: Consumer Choices
Section: Chapter Questions
Problem 17P: If a 10 decrease in the price of one product that you buy causes an 8 increase in quantity demanded...

Related questions

Question
Suppose that Tim and Alyssa are the only consumers of pizza slices in a particular market. The following table shows their annual
Transcribed Image Text:2. Individual and market demand
Suppose that Tim and Alyssa are the only consumers of pizza slices in a particular market. The following table shows their annual demand schedules:
Price
Tim's Quantity Demanded
Alyssa's Quantity Demanded
(Dollars per slice)
(Slices)
40
(Slices)
70
2
30
50
3
20
30
4
15
10
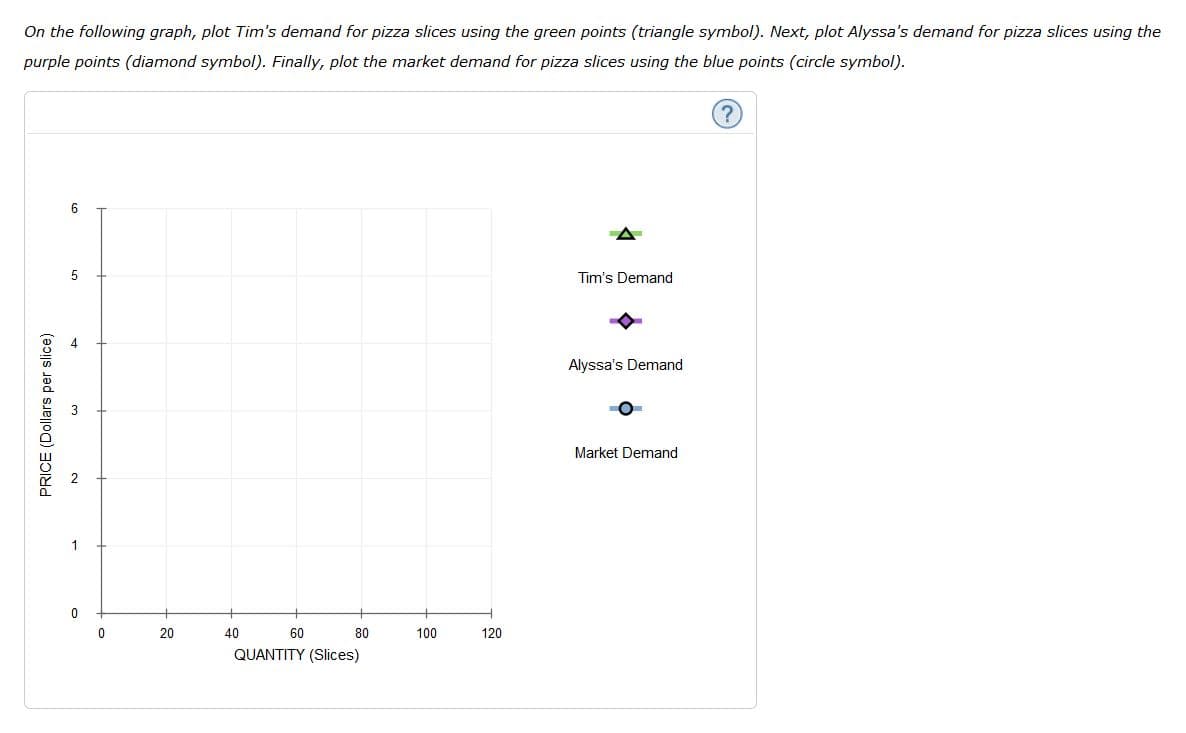
Transcribed Image Text:On the following graph, plot Tim's demand for pizza slices using the green points (triangle symbol). Next, plot Alyssa's demand for pizza slices using the
purple points (diamond symbol). Finally, plot the market demand for pizza slices using the blue points (circle symbol).
Tim's Demand
Alyssa's Demand
Market Demand
1
20
40
60
80
100
120
QUANTITY (Slices)
PRICE (Dollars per slice)
2.
Expert Solution
This question has been solved!
Explore an expertly crafted, step-by-step solution for a thorough understanding of key concepts.

This is a popular solution!

Trending now
This is a popular solution!

Step by step
Solved in 3 steps with 2 images

Knowledge Booster


Learn more about
Need a deep-dive on the concept behind this application? Look no further. Learn more about this topic, economics and related others by exploring similar questions and additional content below.Recommended textbooks for you
Principles of Economics 2e
Economics
ISBN:
9781947172364
Author:
Steven A. Greenlaw; David Shapiro
Publisher:
OpenStax

Essentials of Economics (MindTap Course List)
Economics
ISBN:
9781337091992
Author:
N. Gregory Mankiw
Publisher:
Cengage Learning

Brief Principles of Macroeconomics (MindTap Cours…
Economics
ISBN:
9781337091985
Author:
N. Gregory Mankiw
Publisher:
Cengage Learning
Principles of Economics 2e
Economics
ISBN:
9781947172364
Author:
Steven A. Greenlaw; David Shapiro
Publisher:
OpenStax
Essentials of Economics (MindTap Course List)
Economics
ISBN:
9781337091992
Author:
N. Gregory Mankiw
Publisher:
Cengage Learning
Brief Principles of Macroeconomics (MindTap Cours…
Economics
ISBN:
9781337091985
Author:
N. Gregory Mankiw
Publisher:
Cengage Learning


Principles of Macroeconomics (MindTap Course List)
Economics
ISBN:
9781305971509
Author:
N. Gregory Mankiw
Publisher:
Cengage Learning