2. It is claimed that the average age of working students in a certain university is 35 years. A researcher selected a random sample of 25 working students. The sample mean of their ages resulted to 32 years with a standard deviation of 10 years. Does this mean that the average age of the working students is different from 35 years? Use 0.05 level of significance and assume normality in the population. Step1. Null & Alternative hypothesis Step 2. Level of Significance: 0.05 Step 3. Compute for the test statistic Step 4. Determine the Critical Value d. df= n-1
2. It is claimed that the average age of working students in a certain university is 35 years. A researcher selected a random sample of 25 working students. The sample mean of their ages resulted to 32 years with a standard deviation of 10 years. Does this mean that the average age of the working students is different from 35 years? Use 0.05 level of significance and assume normality in the population. Step1. Null & Alternative hypothesis Step 2. Level of Significance: 0.05 Step 3. Compute for the test statistic Step 4. Determine the Critical Value d. df= n-1

Functions and Change: A Modeling Approach to College Algebra (MindTap Course List)
6th Edition
ISBN:9781337111348
Author:Bruce Crauder, Benny Evans, Alan Noell
Publisher:Bruce Crauder, Benny Evans, Alan Noell
Chapter1: Functions
Section1.2: Functions Given By Tables
Problem 2TU: Use the table of values you made in part 4 of the example to find the limiting value of the average...

Related questions
Question
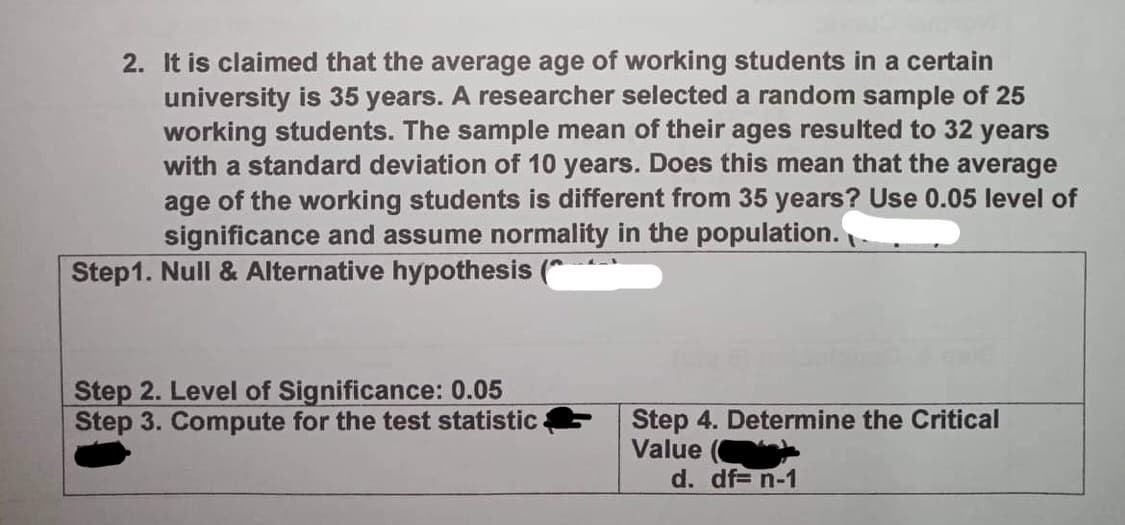
Transcribed Image Text:2. It is claimed that the average age of working students in a certain
university is 35 years. A researcher selected a random sample of 25
working students. The sample mean of their ages resulted to 32 years
with a standard deviation of 10 years. Does this mean that the average
age of the working students is different from 35 years? Use 0.05 level of
significance and assume normality in the population.
Step1. Null & Alternative hypothesis
Step 2. Level of Significance: 0.05
Step 3. Compute for the test statistic
Step 4. Determine the Critical
Value
d. df= n-1
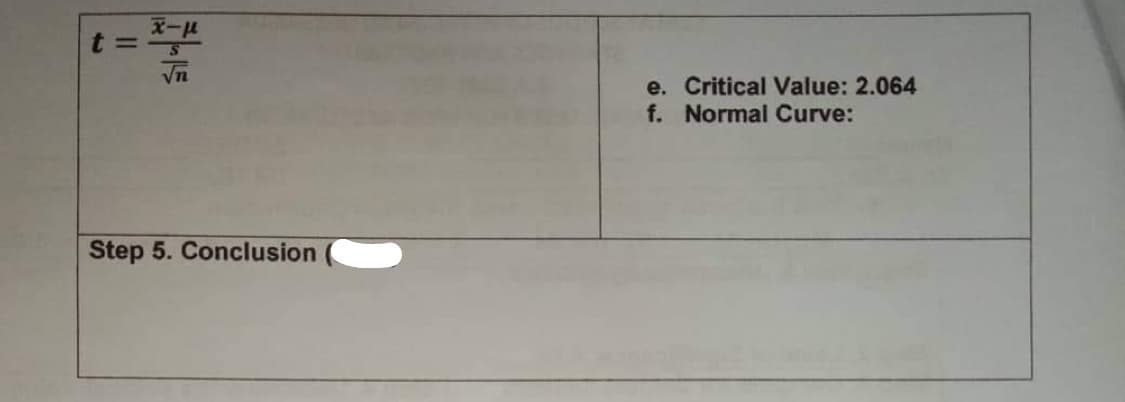
Transcribed Image Text:x-P
t=-s
√n
Step 5. Conclusion
e. Critical Value: 2.064
f. Normal Curve:
Expert Solution
This question has been solved!
Explore an expertly crafted, step-by-step solution for a thorough understanding of key concepts.

Step by step
Solved in 4 steps with 1 images

Recommended textbooks for you
Functions and Change: A Modeling Approach to Coll…
Algebra
ISBN:
9781337111348
Author:
Bruce Crauder, Benny Evans, Alan Noell
Publisher:
Cengage Learning
Functions and Change: A Modeling Approach to Coll…
Algebra
ISBN:
9781337111348
Author:
Bruce Crauder, Benny Evans, Alan Noell
Publisher:
Cengage Learning