

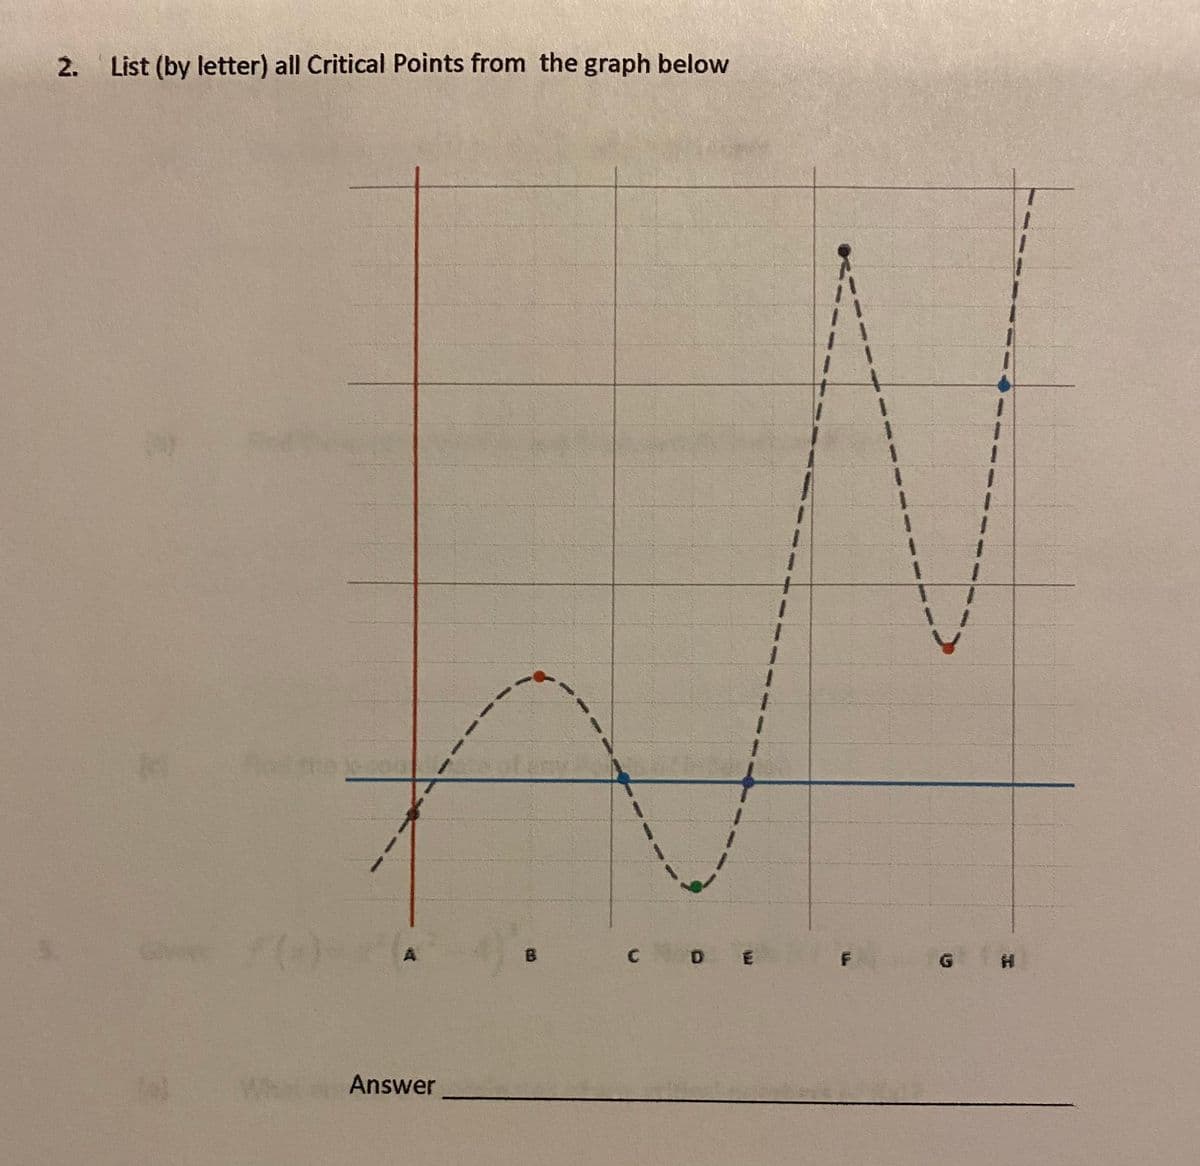
Q: Mark the critical points on the following graph. a*e- 4 44+ 40 36 32 28 24 20 16 12 4
A:
Q: If my p-value = .322 and my significant level is .05 , then
A:
Q: 1. What is meant when talking about balking with respect to queuing theory?
A: To explain the meaning of balking with respect to queuing theory.
Q: Assume that your stock of sales merchandise is maintained based on the forecast demand. If the…
A: (a). Find the forecast for September using a simple three-month moving average: The forecast for…
Q: 12. APL Pharmaceutical has 5 sales person and wants to assign to 5 sales region. The amount of tme…
A: The assignment problem will be solved by the Hungarian method. Step 1. Determine pi , the minimum…
Q: " (a) The following table gives the number of defects in carpets manufactured: Carpet Serial No. : 1…
A:
Q: Consider the market depicted in the graph and assume the government imposes a price floor of P2. At…
A: *Answer: The following options are correct Option A Without an enforcement mechanism, the effect…
Q: The table below was made at the end of October 2018 and shows the monthly percentage unemployment…
A: A) scale 0 to 50% B) scale 0 to 100%
Q: Consider the following. Slick Slack is a downloadable app that can be used to automatically generate…
A: Here we will find the marginal change,
Q: The number of observations (n) is 65 individuals. The researcher suggests using 7 class intervals to…
A: Given that, The researcher wishes to use graphical descriptive methods to present summaries of the…
Q: 1. Present the information in the tables in a graphical form. Choose an appropriate type of graph to…
A: The given data of findings is the categorical data, where the variable-findings is categorized into…
Q: When is the use of single-value grouping particularly appropriate?
A: Quantitative variable: A variable that provides numerical values of individual and arithmetic…
Q: 7. Using the 2k > n guideline to determine the suggested number of classes, when the number of data…
A: 2k>=n Number of data values =260
Q: Lahey Motors specializes in selling cars to buyers with a poor credit history. Listed is the number…
A: Given: n = 36
Q: By referring to the first graph, the define the type of risks: 1.1. Total Risk. 1.2.…
A: The define the type of risks: Total Risk. Systematic Risk (Non-Diversifiable Risk) Unsystematic…
Q: Graph Input Tool Market for Research Assistants 18 IWage (Dollars per hour) 4 16 Supply Labor…
A: *answer:
Q: Mark the critical points on the following graph. 136
A: Solution is below
Q: Discuss the difference between a spurious and intervening relationship.
A: The spurious relationships: When ever two factors are casually similar or related to one another but…
Q: In ZTR Industries it is known for a variable quality control process that the upper and lower…
A: It is an important part of statistics . It is widely used .
Q: What is the domain of fog?
A:
Q: Former pro football star O.J. Simpson was accused of murdering his wife. In the trial, a defense…
A: The tree diagram is given as follows:
Q: The following table gives the number of defects in carpets manufactured: carpet seriel No 2 3 4 8…
A:
Q: The manager of a salmon cannery suspects that the demand for her product is closely related to the…
A: (a) Use EXCEL to construct the scatter plot. EXCEL procedure: Go to EXCEL Go to Insert menu…
Q: be your minimum score if you want to belong to the upper 10% of the group?
A: We have given that. X~N( μ , ?^2 ) μ =38 , ? =4 Z-score =( x - μ )/?
Q: Adnan is the branch manager at a local insurance company. Recently, Adnan’s been receiving customer…
A: Using R codes : Histogram, Frequency polygon, ogive, steam and leaf and bar-plot are given below :…
Q: Calculate the second, third and fourth moment. * Class 0-10 60-70 10-20 20-30 30-40 40-50 50-60 12…
A: Given: The provided data is: Class Frequency 0-10 4 10-20 7 20-30 8 30-40 12 40-50 25…
Q: Consider the following. Slick Slack is a downloadable app that can be used to automatically generate…
A: Given problem:- Consider the following. Slick Slack is a downloadable app that can be used to…
Q: In ZTR Industries it is known for a variable quality control process that the upper and lower…
A: The process capability (Cp) is a statistic used to measure if the natural tolerance limits meet the…
Q: Refer to Figure 8.19 Sensitivity Report for the Digital Controls, Inc. . . Intrepret the ranges of…
A: The objective coefficient range for variable AM is no lower limit to 11.75 because the objective…
Q: Lahey Motors specializes in selling cars to buyers with a poor credit history. Listed is the number…
A:
Q: Two workers receive a daily allowance and an hourly rate 2 for their pay as shown in the graph and…
A:
Q: 1. The number of heart patients diagnosed in each of seven leading cities in the Philippines in 1992…
A: Pie chart is the type of graph that used to represent one variable with different levels. It also…
Q: For the Burger Dome single-channel waiting line, assume that the arrival rate is 1 customer per…
A: Computation of probability that no units are in the system: The probability that no units are in…
Q: 45. The following information relating to workers in an industrial town is given: Consumer Price…
A:
Q: For the situation considered in the previous problem, what is the value of a six- month European put…
A: We have to find the six month European put option.
Q: 1.what are the critical points of (
A: The inequalities are the quantities used to compare two numbers or two mathematical expressions. The…
Q: Answer question #9. Show the graph of the rejection region.
A: Instruction : Answer question #9. Show the graph of the rejection region. Here, the given…
Q: Refer to the comparison line graph which shows how the net worth of Claire Kozar's retirement…
A: Consider the graph provided in question. The graph represents the retirement savings at different…
Q: possible points. These points come from 5 homework sets that are worth 10 points each and 3 exams…
A:
Q: The set of critical numbers of fx) -3 x. are
A:
Q: Having a brother increases one's monthly earnings by $200." Why is this an example of an…
A: Given: “Having a brother increases one's monthly earnings by $200." this statement gives the…
Q: For eight pairs of observations on two variables sales (X) and Pricing (Y), the following results…
A:
Q: Percentage of Cooking Time 3.0 Hours Hardwood Pressure Concentration 400 500 650 196.6 197.7 199.8…
A: Anova Table for three factors Consider the three factor experimental design with underlying model…
Q: 12. Which of these areas is a minor sector?
A: A sector is a portion that is bounded by two radii and an arc. The smaller portion is called a minor…
Q: Second, the researcher wishes to use graphical descriptive methods to present summaries of the data…
A: a) One of the conditions for selecting the number of classes is, 2number of classes ≥ sample…

Step by step
Solved in 2 steps with 2 images


- For each of the following variables, indicate whether they are categoricalor numerical. Also, write down what type of graph can be drawn for each.a) Civil status of participants.b) Height of participants.The second attachment includes the possible diagramsFor each problem, write which test you used in your calculator, draw the graph, calculate pvalue, and write your conclusion in a complete sentence.Mars Inc., makers of M&M candies, claims that they produce M&Ms with the following color distribution: Brown: 30% Red: 20% Yellow: 20% Orange: 10% Green: 10% Blue 10% A SRS of M&Ms bags were selected from the grocery store shelf and produced the following color counts: Brown: 120 Red: 57 Yellow: 63 Orange: 42 Green: 27 Blue: 21 Conduct a hypothesis test to see if the manufacturer’s claim for the proportion of orange M&Ms is correct.
- In 2011 the United States federal government decided that all businesses must pay their employees a minimum wage of $7.25 per hour. However, state governments could decide that businesses in their states should pay their employees more than the $7.25 per hour. Below is a graph of hourly minimum wage requirements for five states. Use the information provided in the graph to decide which of the following statements is NOT TRUE! New York's hourly wage requirement is about the same as the federal minimum wage requirement. The hourly wage in Ohio is more than $1 above the hourly wage in Minnesota. Oregon has the highest hourly wage requirement at over $8.00 per hour. The hourly wage in New York is more than double the hourly wage in Georgia.Consider the market depicted in the graph and assume the government imposes a price floor of P2. At P2, 150 units of the good are supplied (wish to be sold) and 50 units of the good are demanded (wish to be bought). Choose the correct ones: Without an enforcement mechanism, the effect of a binding price floor will be negligible because it will simply be ignored because buyers and sellers enrich themselves by trading below the floor price. With an enforcement mechanism, the effect of a binding price floor may still be negligible if the enforcement mechanism is easy to evade or doesn't impose a significant penalty for selling below the price floor. Without an enforcement mechanism, the effect of a binding price floor will be negligible because it will simply be ignored because buyers and sellers enrich themselves by trading above the floor price. With an enforcement mechanism, the effect of a binding price floor may still be negligible if the enforcement mechanism is easy to evade or…2. Consider the following graph: Which statement is false?
- This critical point is a Min or Max or saddleThe National Highway Association is studying the relationship between the number of bidders on a highway project and the winning (lowest) bid for the project. Of particular interest is whether the number of bidders increases or decreases the amount of the winning bid. Bidders Price 9.0 5.1 9.0 8.0 3.0 9.7 10.0 7.8 5.0 7.7 10.0 5.5 7.0 8.3 11.0 5.5 6.0 10.3 6.0 8.0 4.0 8.8 7.0 9.4 7.0 8.6 7.0 8.1 6.0 7.8 Given: Correlation of Coefficient: 0.7064 (This is correct) Coefficient of determination: 49.90% (This is correct) ŷ = 11.2360 + (-0.4667)x (This is correct) Create a scatter plot of the data Complete a regression analysis of the relationship. Slope = ______ Estimate the winning bid if there were seven bidders. Winning bid cost ______ millions. Compute the 95% prediction interval for a winning bid if there are seven bidders. [ _____________, ______________]The National Highway Association is studying the relationship between the number of bidders on a highway project and the winning (lowest) bid for the project. Of particular interest is whether the number of bidders increases or decreases the amount of the winning bid. Bidders Price 9.0 5.1 9.0 8.0 3.0 9.7 10.0 7.8 5.0 7.7 10.0 5.5 7.0 8.3 11.0 5.5 6.0 10.3 6.0 8.0 4.0 8.8 7.0 9.4 7.0 8.6 7.0 8.1 6.0 7.8 GIVEN: correlation coefficient: - 0.7064 Slope: -0.4667 Coefficient of determination: 49.90% regression equation: ŷ= 11.2360 + (-4467)x FIND: Estimate the winning bid if there were seven bidders. Winning bid cost _________ millions. Explain. Compute the 95% prediction interval for a winning bid if there are seven bidders. [ _______________ , _______________ ] (Explain).
- When a vertex Q is connected by an edge to a vertesx K, what is the term for the relationship between Q and K A. Q and K are "isolated" B. Q and K are adjacent C. Q and K are "insecure" D. Q and K are "incident"Jensen Tire & Auto is in the process of deciding whether to purchase a maintenance contract for its new computer wheel alignment and balancing machine. Managers feel that maintenance expense should be related to usage, and they collected the following information on weekly usage (hours) and annual maintenance expense (in hundreds of dollars). Weekly Usage(hours) AnnualMaintenance Expense 19 24 16 29 26 37 34 44 38 54 23 38 30 40 37 46 46 59 44 47 -select your answer choices- b. p-value less than 0.01 between 0.01 and 0.025 between 0.025 and 0.05 between 0.05 and 0.10 greater than 0.10 Conclusion Do not conclude that there is a significant relationship between expense and weekly usage Conclude that there is a significant relationship between expense and weekly usage d. No, the expected maintenance expense is less than $3000 Yes, the expected maintenance expense is greater than $3000Which of the following points on this graph would be considered an outlier? a, b, c, or d? Why?