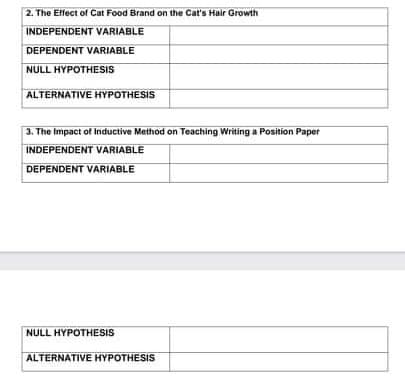
2. The Effect of Cat Food Brand on the Cat's Hair Growth INDEPENDENT VARIABLE DEPENDENT VARIABLE NULL HYPOTHESIS ALTERNATIVE HYPOTHESIS


Q: 4D. Articles are mass-produced to a specified width of 0.15 cm. In order to check that the…
A:
Q: Assume the least squares equation is Ŷ= 10 + 20X. What does the value of 10 in the equation…
A: The above regression equation is y on x. So option (i) is incorrect. Here 10 is intercept of x on…
Q: Q2) Fit a nonlinear form as follows to the x and y values y = a₁ + ² X X 2 3 4 5 y 22.7 23.7 24.7…
A:
Q: 4. The Impact of the Level of Native Language Proficiency on the Literacy Achievement of English…
A: Here literacy achievement of English language leisures(2012) depends on the level of Native language…
Q: A sample of 16 participants took part in a hearing experiment. Among other things, the absolute…
A: Frequency Polygon Frequency polygons are a diagrammatic representation of distribution that adopts…
Q: Q2) Life of a battery in hours is known to be approximately normally distributed with standard…
A: The question is about hypo. testing Given : Pop. std. deviation of life of battery ( σ ) = 1.25…
Q: In a specific year, SAT scores were Normally distributed with mean 1026 and standard deviation 209;…
A: Solution-: (a) Given: μ=1026,σ=209 We find P(scores will be above 1300)=? (b) Given: μ=1500,σ=250 We…
Q: Salaries of 50 college graduates who took a statistics course in college have Click here to view at…
A: Given,sample size(n)=50mean(x¯)=65200population standard…
Q: If x is a random variable (3,x-bn), find the smallest value for n so that it achieves 0.8 <(1 2 p(x)…
A: If a random variable X follows binomial distribution. X~Bx, n, p=13 and PX≥1>0.8 We need to find…
Q: A survey of athletes at a high school is conducted, and the following facts are discovered: 6% of…
A: It is given that P(football) = 0.06 P(basketball) = 0.70 P(football and basketball) = 0.04
Q: For a Normal Random Variable X with a mean of 80 and a Standard Deviation of 7, find P(X<73)
A:
Q: Engineering. Find the number of orders in which the four students from this chess club can win the…
A: It is given that Number of students from school of computing = 5 Number of students from school of…
Q: Recorded here are the germination times (in days) for 13 randomly chosen seeds of a new type of…
A: Solution-: Given: c=0.90 (Confidence level) We have following data: xi 13 18 11 15 19 18 17 14…
Q: b. Rice Bodi (25) Sugar (90) Bodi (25) Egg Plant (75) = Rice The pie chart above shows the allotment…
A: The question is based on a pie chart Given : From pie chart,
Q: If a person tests positive, what is the probability that the person actually has the disease?
A: Let us define some events A : a person has cooties. B : a person does not have cooties. E : a person…
Q: Statistical Analysis - Data Management Per each graph, answer the following: Any relevant…
A: Pie chart is a graphical method of representing categorical data.
Q: 5. When you draw one of the die out of the velvet pouch, what is the probability that you have drawn…
A: here given , there are 2 dice , one is standard and other is weighted Die For standard die…
Q: The temperatures (Observed and Expected) in centigrade for certain concrete mix sample have been…
A:
Q: Pedestrian Deaths river Pedestrian Intoxicated? kicated? Yes No Yes 62 73 No 284 560 of the…
A: Given The table summarizes results from 979 pedestrian deaths that were caused by automobile…
Q: (a) Consider a t distribution with 21 degrees of freedom. Compute P (tz 1.97). Round your answer to…
A: a) The degrees of freedom is 21.
Q: In a specific year, SAT scores were Normally distributed with mean 1026 and standard deviation 209;…
A: i) SAT scores were Normally distributed with mean 1026 and standard deviation 209; μ=1026σ=209 ii)…
Q: he retirement age of National Football League (NFL) players is Normally distributed with a mean of…
A:
Q: A genetic experiment with peas resulted in one sample of offspring that consisted of 435 green peas…
A: The provided information is n=435+161=596 x=161 for yellow peas sample proportion is…
Q: Suppose X₁,..., Xn are independent exp(X) random variables, where X is the rate parameter. Find…
A:
Q: A study of the consultants in a particular industry has determined that the standard deviation of…
A: Given Standard deviations=16 Sample mean=118 n=60
Q: You are interested in finding a 90% confidence interval for the mean number of visits for physical…
A: Given data set22,12,6,23,13,12,28,14,10,13,18,7,11,19,18sample size(n)=15confidence interval = 90%
Q: Directions: 1. Test the hypothesis in the given situation. 2. Follow the steps in hypothesis testing…
A: Givensample size(n)=40x=25p^=xn=2540=0.625level of significance(α)=0.10
Q: Zaire buys a bag of cookies that contains 7 chocolate chip cookies, 5 peanut butter cookies, 9 sugar…
A: It is given that the Zaire buys a bag of cookies that contains 7 chocolate chip cookies, 5 peanut…
Q: X~N(40,?2) and P(X>50) = 0.119. Find the value of ?.
A: From the provided information, Mean (µ) = 40 Variance = σ2 X~N (40, σ2)
Q: J and K are independent events. P(J | K) = 0.2. Find P(J) P(J) =
A: Obtain the probability of P(J). The probability of P(J) is obtained below as follows: From the…
Q: Section H: Hyla chrysoscelis is a type of gray tree frog with a distinct mating call. Frogs are…
A: Solution The analysis is the regression analysis .
Q: A builder claims that heat pumps are installed in 70% of all homes being constructed today in the…
A: The null and alternative hypotheses are: H0: The true proportion of heat pumps installed in the city…
Q: Home Work 10.4-2 Date for traveling speed versus stopping distance of Home Work 10.3-2 has been…
A: The following information has been given : Traveling Speed V Stopping Distance ∆ 49 15 9 2…
Q: Use the spinner below to find the probability of getting the following after 1 spin. 12 1 11 2 5…
A:
Q: random from the jar. Find the probability of the given event. Please enter reduced fractions. (a)…
A: PppWe It is given that Red marbles = 24 Blue marbles = 34 Red odd number marbles = 12 Blue odd…
Q: Statistical Analysis - Data Management Per each graph, answer the following: Any relevant…
A: Bar charts are useful in comparing categories of a variable or two categorical variables.
Q: Here are the numbers of calls received at a customer support service during 10 randomly chosen,…
A: a) Median: Median is the middle most value of a set of observations.
Q: Consider a confidence interval, with confidence coefficient 1 - a, for the mean of a normal…
A:
Q: A hacker is trying to guess someone's password. The hacker knows (somehow) that the password is 5…
A: Please see below
Q: In a specific year, SAT scores were Normally distributed with mean 1026 and standard deviation 209;…
A: given Mean=1026 Standard deviations=209
Q: The correlation between two variables is r = −.78 based on a sample size of 137.
A: "Since you have asked multiple questions, we'll solve the first question for you. If you want any…
Q: e situations, answer the following. a. State the null and alternative hypothesis in words. b. State…
A: Given: Confidence level is 95%. Period of degree is 5 years.
Q: If one student is chosen at random, find the probability that the student was male OR got an "B".…
A: It is given that Number of males = 44 Number of students with B = 14 Number of males with B = 8…
Q: A jar contains 10 red marbles numbered 1 to 10 and 8 blue marbles numbered 1 to 8. A marble is drawn…
A: Given data A jar contains 10 red marbles numbered 1 to 10 and 8 blue marbles numbered 1 to 8
Q: The temperatures (Observed and Expected) in centigrade for certain concrete mix sample have been…
A: The question is about correlation and regression Given :
Q: Find the area of the shaded region. The graph depicts the standard normal distribution with mean 0…
A:
Q: Packets of breakfast cereal are said to contain 550g. The manufacturer knows that the weights are…
A:
Q: Eight schoolchildren, chosen at random from the first year of a large school, were given, without…
A:
Q: According to a PEW Research Center survey, the mean student loan at graduation is $25,000. Suppose…
A:
Q: 17. What is the test statistic and its distribution for the hypothesis test stated in the preamble…
A: It is given that For the IQ scores of sample of boys Mean = 106 Sample standard deviation = 4…

Step by step
Solved in 2 steps

- Cholesterol Cholesterol in human blood is necessary, but too much can lead to health problems. There are three main types of cholesterol: HDL (high-density lipoproteins), LDL (low-density lipoproteins), and VLDL (very low-density lipoproteins). HDL is considered “good” cholesterol; LDL and VLDL are considered “bad” cholesterol. A standard fasting cholesterol blood test measures total cholesterol, HDL cholesterol, and triglycerides. These numbers are used to estimate LDL and VLDL, which are difficult to measure directly. Your doctor recommends that your combined LDL/VLDL cholesterol level be less than 130 milligrams per deciliter, your HDL cholesterol level be at least 60 milligrams per deciliter, and your total cholesterol level be no more than 200 milligrams per deciliter. (a) Write a system of linear inequalities for the recommended cholesterol levels. Let x represent the HDL cholesterol level, and let y represent the combined LDL VLDL cholesterol level. (b) Graph the system of inequalities from part (a). Label any vertices of the solution region. (c) Is the following set of cholesterol levels within the recommendations? Explain. LDL/VLDL: 120 milligrams per deciliter HDL: 90 milligrams per deciliter Total: 210 milligrams per deciliter (d) Give an example of cholesterol levels in which the LDL/VLDL cholesterol level is too high but the HDL cholesterol level is acceptable. (e) Another recommendation is that the ratio of total cholesterol to HDL cholesterol be less than 4 (that is, less than 4 to 1). Identify a point in the solution region from part (b) that meets this recommendation, and explain why it meets the recommendation.Q) Create a conceptual model and also develop null and alternate hypotheses of the following. The labor force heterogeneity enhances more to organizational effectiveness because each group brings its own special expertise and skills to the workplace. Collaboration can be leveraged, however, only if managers know how to tackle the special talents of the different working group; otherwise, they will remain unexploited.Create a conceptual model and also develop null and alternate hypotheses of the following. The labor force heterogeneity enhances more to organizational effectiveness because each group brings its own special expertise and skills to the workplace. Collaboration can be leveraged, however, only if managers know how to tackle the special talents of the different working group; otherwise, they will remain unexploited.
- Abstract To cooperate effectively, both in small-scale interactions and large-scale collective-action problems, people frequently have to delay gratification (i.e., resist short-term temptations in favor of joint long-term goals). Although delay-of- gratification skills are commonly considered critical in children’s social-cognitive development, they have rarely been studied in the context of cooperative decision-making. In the current study, we therefore presented pairs of children (N = 207 individuals) with a modified version of the famous marshmallow test, in which children’s outcomes were interdependently linked such that the children were rewarded only if both members of the pair delayed gratification. Children from two highly diverse cultures (Germany and Kenya) performed substantially better than they did on a standard version of the test, suggesting that children are more willing to delay gratification for cooperative than for individual goals. The results indicate that from…Abstract To cooperate effectively, both in small-scale interactions and large-scale collective-action problems, people frequently have to delay gratification (i.e., resist short-term temptations in favor of joint long-term goals). Although delay-of- gratification skills are commonly considered critical in children’s social-cognitive development, they have rarely been studied in the context of cooperative decision-making. In the current study, we therefore presented pairs of children (N = 207 individuals) with a modified version of the famous marshmallow test, in which children’s outcomes were interdependently linked such that the children were rewarded only if both members of the pair delayed gratification. Children from two highly diverse cultures (Germany and Kenya) performed substantially better than they did on a standard version of the test, suggesting that children are more willing to delay gratification for cooperative than for individual goals. The results indicate that from…22. Is there multicollinearity in the model? Yes, No or Cannot be determined?
- A researcher wants to explore the differences in health effects from two different types of sugar. She hypothesizes that artificial sweetener has lower long term health benefits than natural sugar. What is her null hypothesis? Fill in the blank. H0: μArtificalSweetener__________ μNaturalSugar Group of answer choices a) Less than b) Less than or equal to c) Greater than d) Greater than or equal toTwo different areas of large eastern city are being considered as sites for day care centers. Of 200 households surveyed in one section, the proportion in which the mother worked full time was 0.52. In another section, 40 % of the 150 households surveyed had mothers working at full time jobs. At the 0.04 level of significance, is there a significant difference in the proportions of working mothers in the two areas of the city? A coal fired power plant is considering two different systems for pollution abatement .The first system has reduced the emission of the pollutants to acceptable levels 68 percent of the time, as determined from 200 air samples. The second, more expensive system has reduced the emission of pollutants to acceptable levels 76 percent of the time, as determined from 250 air samples. If the expensive system is significantly more effective than the inexpensive system in reducing pollutants to acceptable levels, then the management of the power plant will install the…need to show the 5 step hypothesis
- A researcher wants to know why individuals in Community A have a higher rate of a rare form of cancer when compared to those living in Community B. To find out the reasons for the differences in cancer rates in these two communities, the investigator surveyed residents about their lifestyle, noted the types of businesses that were present in the community and searched medical records. The researcher found that the headquarters for the Toxico Chemical Plant is located in Community A, there is a higher rate of cigarette smoking in this community and residents tended to delay or skip going to the doctor for an annual checkup. In Community B, the largest employer was a department store and on average, residents did not smoke as much as residents from Community A. However, like individuals from Community A, Community B residents tended to delay or skip their annual checkup with their doctor. 1. What makes this a descriptive study?A nationwide survey of 1000 adults found that 50% of respondents favored a plan to break up the 12 megabanks, which then controlled about 69% of the banking industry. Complete parts (a) and (b) below. Question content area bottom Part 1 a. Identify the population and sample for this study. Choose the correct answer below. A. The population is all adults in the country who favored breaking up the megabanks. The sample is the 1000 adults surveyed. B. The population is the 1000 adults surveyed. The sample is those adults who favored breaking up the megabanks. C. The population is all adults in the country. The sample is those adults who favored breaking up the megabanks. D. The population is all adults in the country. The sample is the 1000 adults surveyed. Part 2 b. Is the percentage provided a descriptive statistic or an inferential statistic? Explain your answer. A. The percentage is a descriptive statistic, since it…A school Psychologist is interested in the effect of violent television programs on a child's agression depending on if the show is a cartoon or not. Eighty children were recruited and were divided into equal groups. Half of the children watched a violent television program while the other half watched a non- violent program. Half of the children watched a cartoon while the other half watched a show that was not a cartoon. The children were then placed in a small group and the researcher measured the level of agressiveness of each child. A) z- test B) t - test C) test independent samples D) T - TEST RELATED SAMPLES E) ANOVA F) FACTORIAL ANOVA G) repeated measures ANOVA H) pearson correlation i) chi square

