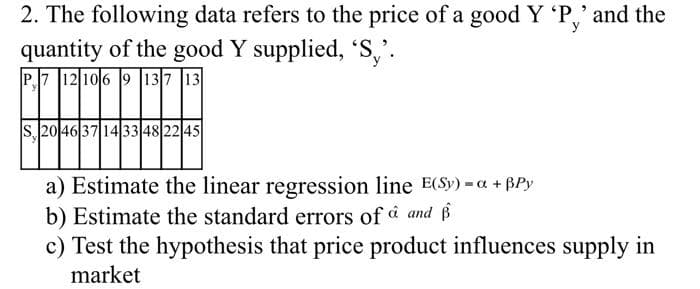
2. The following data refers to the price of a good Y 'P,' and the quantity of the good Y supplied, 'S'. P7 12 106 9 137 13 S, 20 46 37 14 33 48 22 45 a) Estimate the linear regression line E(Sy) =a + BPy b) Estimate the standard errors of and


Q: Assume the two population variances are equal. i. Test at the 1% level of significance that the…
A: Followings are the Explanation of the question Hypothesized Population Mean (µ) = 9 gm/L The…
Q: 13.Find a 95% CI on the mean volume of syrup dispensed? a) 19.79, 29.21 b) 12.12, 16.23 c) 62.10,…
A: Note: Questions 13,14 and 15 are three different questions. As per the guidelines, I have to answer…
Q: A particular fruit's weights are normally distributed, with a mean of 766 grams and a standard…
A: Solution
Q: Assuming that you sample without replacement, select all possible samples of n = 2 and construct the…
A: here given , population {1 ,4,7 } now selecting sample of size 2 without replacement so there are…
Q: Suppose the average weight for a green apple is 153 grams, with a standard deviation of 27 grams,…
A: GivenFor Green apple Mean(μ)=153standard deviation(σ)=27For Red appleMean(μ)=200standard…
Q: The five number summary of a dataset was found to be: 1, 5, 12, 15, 19 An observation is considered…
A:
Q: D5) Statistics and Probability A plant manager is considering investing in a new $40,000 machine.…
A: Given information: Investment amount = $40,000 Expected cash flow = $9,000 Actual cash…
Q: Let x be a continuous random variable that is normally distributed with mean μ = 27 and standard…
A: GivenMean(μ)=27standard deviation(σ)=4
Q: An economist at the Florida Department of Labor and Employment needs to estimate the unemployment…
A: Sample size n = 356 Sample proportion p^ = 0.029 Formula Used: Confidence Interval = p^ ± Margin…
Q: The variable xx denotes the time taken in seconds for a computer link to be made between the…
A: It is given that the mean is 15 and the standard deviation is 3.
Q: a) Consider a t distribution with 11 degrees of freedom. Compute P(-1.03 <t<1.03). Round your answer…
A: a) Given data : Degree of freedom, df = 11
Q: Whn determining whether there is a correlation between two variables ,one should use a to explore…
A: Correlation is a measure of association between two continuous variables.
Q: An airline company recently boasted about its 73% customer satisfaction rate. A corporate watchdog…
A: The hypotheses for the test are given below. Null hypothesis: H0: p = 0.73 Alternative hypothesis:…
Q: Each student in a class has a box of Reese's pieces containing 25 candies. (The following is how…
A: Given: Sample size n = 25 Formula used: Sample proportion p = Xn
Q: For each research scenario below, indicate: which hypothesis test (z-score test, one-sample t-test,…
A: Given:a)µ=73.4M=3s=8.40Sample size (n)=150b)n=100µ0=480X¯=536σ2=102
Q: a. For this study, we should use Select an answer b. The null and alternative hypotheses would be:…
A: The hypothesized proportion is 0.54.
Q: c) Graph both lines on the same grid. Choose appropriate scales and don't forget to label the axis…
A: Two tutors Mr. T = enrollment =40 and 20/hour tutoring fees Mr. U= no enrollment charges, but…
Q: Q3: Let X₁.X Exponential(8) (1) Find UMP test of size a for testing Ho: 0= 1 against H₁:0>1. (2) For…
A:
Q: Sample 12345678 2 9 10 11 12 13 Temperature 185 183 187 188 189 189 192 195 196 198 193 196 200 000…
A: Given: Sample size(n)=14∑x=2693∑y=72002∑x2=518447∑y2=370336678∑xy=13848650
Q: 16% of all college students volunteer their time. Is the percentage of college students who are…
A: We have given that p = 0.16n = 398x = 56p̂ = x/n = 56/398 = 0.1407α = 0.01
Q: XP(Z P(Z) THEN 1.8626= (+P) - 0 < X<N. = TRUE O ERROR O
A: Solution
Q: The work week for adults in the US that work full time is normally distributed with a mean of 47…
A:
Q: Question 11: You generate a scatter plot using Excel. You then have Excel plot the trend line and…
A: To find: What is the correlation coefficient for this data set? r =
Q: A simple random sample of 36 Chowchow dog weights yields a sample mean of 193 pounds. It is known…
A: A simple random sample of 36 Chowchow dog weights; n=36 A sample mean of 193 pounds; x=193 The…
Q: A materials engineer wants to understand the relationship between the strength of plastic cases and…
A: Here researcher wants to know relationship between Temperature and strength. We have to calculate…
Q: THE VALUE OF THE VARIANCE IS ALWAYS NOT POSITIVE. TRUE ERROR
A: The variance is square of standard deviation
Q: The Energy Star rating system is an energy efficiency program run by the U.S. Environmental…
A: Given data…
Q: Question 25: You are conducting a study to see if the proportion of men over the age of 50 who…
A: The following information is provided: The sample size is n = 767 sample proportion is = =…
Q: A random sample has been taken from a normal distribution. Output from a software package is given…
A: Given n=10 Variance=2.576
Q: unfair coins, both favoring heads, are tossed simultaneously for many trials, with the results shown…
A: Solution Probability of any event is equal to the ratio of number of favourable cases divided by…
Q: The computer science department is making a new recruitment poster for computer science majors and…
A:
Q: Carry your intermediate computations to at least three decimal places. Round your answers to one…
A: given data : 2.23,1.76,0.43,0.99,-2.9,-0.35,1.69,-0.1,-0.62,-1.48,-2.53,1.15 from the…
Q: Multiple Choice Each of the numbered items or incomplete statements is followed by answers or by…
A: The answer to each multiple-choice question.
Q: If A and B are independent events and that 0.3= (PA and 0.7 = (PAUB), then .P(B) = 0.571 true Error
A:
Q: 0.00172187 mm 1.72187 mm 0.00000172187 mm None of the above O O O nm = = ? mm
A: Given Conversion question : 1721.87 nm equal to ______mm One nanometer = 1* 10 -6 millimetre…
Q: If I got 18 from 20 in first exam And I got 18 from 20 in second exam And my teacher want to make a…
A: From the given information we find the final marks out of 50
Q: You wish to test the following claim (Ha) at a significance level of a = 0.005. Ho: p = 0.11 Ha:p <…
A:
Q: Question 6: You wish to test the following claim (HaHa) at a significance level of α=0.005α=0.005.…
A: According to the given information in this question We need to apply z test for one population mean
Q: An article contains 1303 words. The frequencies of words with various lengths are given in the…
A: The question is about probability Given :
Q: The accompanying data represent the total travel tax (in dollars) for a 3-day business trip in 8…
A: Use the Excel and calculate the Point estimate (sample Mean and Sample Standard deviation) a) Point…
Q: A single-serve coffee maker is programmed to dispense 10 ounces per cup of coffee. Each month, a…
A: GivenMean(x)=10.22standard deviation(σ)=0.39sample size(n)=29significance level(α)=2.5%=0.025
Q: A civil service exam yields scores which are normally distributed with a mean of 81 and a standard…
A: Solution-: Given: μ=81, σ=5.5 We want to fin x such that, P[X<x]=0.15
Q: 20% of the patron's order the chef's special. The probability that 2 out of the next ten customers…
A: From the provided information, Sample size (n) = 10 20% of the patron's order the chef's special…
Q: A consumer organization wants to estimate the actual tread wear index of a brand name of tires that…
A:
Q: Suppose that, for events A and B, P(A)= 0.2, P(B)= 0.85, and P(AandB)= 0.17. (i) Calculate the…
A:
Q: A production engineer collected a sample of 14 parts to measure their weights. The sample mean was…
A: Given : Sample Size, n = 14 Sample Mean, x̄ = 8.48
Q: Which statement is true about the data shown below (a=0.05) 20 40 60 80 y 24 1.20 1.71 2.22 a. The…
A: The coefficient of determination = r2 or R2
Q: Styles A biotechnology company produces a therapeutic drug whose concentration has a standard…
A:
Q: Can smoking negatively affect one's ability to become pregnant? A study collected data on 654 women…
A: Obtain the proportion of women that were not pregnant were also smokers. The proportion of women…
Q: 7. If the range of the set of scores is 28 and the lowest score is 9, what is the highest score? a.…
A: 7: Range of data set=28 and lowest value =9 Then to find highest value ?

Step by step
Solved in 2 steps with 2 images

- A U.S. state's Bureau of Economic Geology published a study on the economic impact of using carbon dioxide enhanced oil recovery (EOR) technology to extract additional oil from fields that have reached the end of their conventional economic life. The following table gives the approximate number of jobs for the citizens that would be created at various levels of recovery. Percent Recovery (%) 20 40 80 100 Jobs Created (Millions) 6 9 12 18 Find the regression line. j(r) = Use the regression line to estimate the number of jobs that would be created at a recovery level of 60%. _____ million jobsA sixth-grade teacher believes that there is a relationship between his students’ IQscores (y) and the numbers of hours (x) they spend watching television each week. Thefollowing table shows a random sample of 7 sixth-grade students.y 125 116 97 114 85 107 105x 5 10 30 16 41 28 21 Does the data provide sufficient evidence to indicate that the simple linear regressionmodel is appropriate to describe the relationship between x and y? Perform a model utilitytest at α = 0.05. (Give H0, Ha, rejection region, observed test statistic, P-value, decisionand conclusion.)Find the Pearson sample correlation coefficient between x and y. Then interpretthe result.A sales manager collected the following data on x = years of experience and y = annual sales ($1,000s). The estimated regression equation for these data is ŷ = 80 + 4x. Salesperson Years ofExperience Annual Sales($1,000s) 1 1 80 2 3 97 3 4 92 4 4 102 5 6 103 6 8 111 7 10 119 8 10 123 9 11 117 10 13 136 (a) Compute SST, SSR, and SSE. SST=SSR=SSE= (b) Compute the coefficient of determination r2. (Round your answer to three decimal places.) r2 = Comment on the goodness of fit. (For purposes of this exercise, consider a proportion large if it is at least 0.55.) The least squares line provided a good fit as a small proportion of the variability in y has been explained by the least squares line.The least squares line provided a good fit as a large proportion of the variability in y has been explained by the least squares line. The least squares line did not provide a good fit as a large proportion of the variability in y has been explained by the…
- A sales manager collected the following data on x = years of experience and y = annual sales ($1,000s). The estimated regression equation for these data is ŷ = 81 + 4x. Salesperson Years ofExperience Annual Sales($1,000s) 1 1 80 2 3 97 3 4 97 4 4 102 5 6 103 6 8 111 7 10 119 8 10 128 9 11 117 10 13 136 (a) Compute SST, SSR, and SSE. SST= SSR= SSE= (b) Compute the coefficient of determination r2. (Round your answer to three decimal places.) r2 = Comment on the goodness of fit. (For purposes of this exercise, consider a proportion large if it is at least 0.55.) The least squares line provided a good fit as a small proportion of the variability in y has been explained by the least squares line.The least squares line did not provide a good fit as a small proportion of the variability in y has been explained by the least squares line. The least squares line provided a good fit as a large proportion of the variability in y has been explained by the…A sales manager collected the following data on x = years of experience and y = annual sales ($1,000s). The estimated regression equation for these data is ŷ = 80 + 4x. Salesperson Years ofExperience Annual Sales($1,000s) 1 1 80 2 3 97 3 4 97 4 4 102 5 6 103 6 8 101 7 10 119 8 10 118 9 11 127 10 13 136 (a) Compute SST, SSR, and SSE. SST = SSR = SSE = (b) Compute the coefficient of determination r2. (Round your answer to three decimal places.) r2 = Comment on the goodness of fit. (For purposes of this exercise, consider a proportion large if it is at least 0.55.) The least squares line provided a good fit as a small proportion of the variability in y has been explained by the least squares line. The least squares line did not provide a good fit as a small proportion of the variability in y has been explained by the least squares line. The least squares line provided a good fit as a large proportion of the variability in y has been explained by the…A sales manager collected the following data on x = years of experience and y = annual sales ($1,000s). The estimated regression equation for these data is ŷ = 81 + 4x. Salesperson Years ofExperience Annual Sales($1,000s) 1 1 80 2 3 97 3 4 92 4 4 107 5 6 103 6 8 111 7 10 119 8 10 128 9 11 117 10 13 136 (a) Compute SST, SSR, and SSE. SST = SSR = SSE = (b) Compute the coefficient of determination r2. (Round your answer to three decimal places.) r2 = Comment on the goodness of fit. (For purposes of this exercise, consider a proportion large if it is at least 0.55.) The least squares line provided a good fit as a large proportion of the variability in y has been explained by the least squares line.The least squares line did not provide a good fit as a large proportion of the variability in y has been explained by the least squares line. The least squares line provided a good fit as a small proportion of the variability in y has been explained by the…