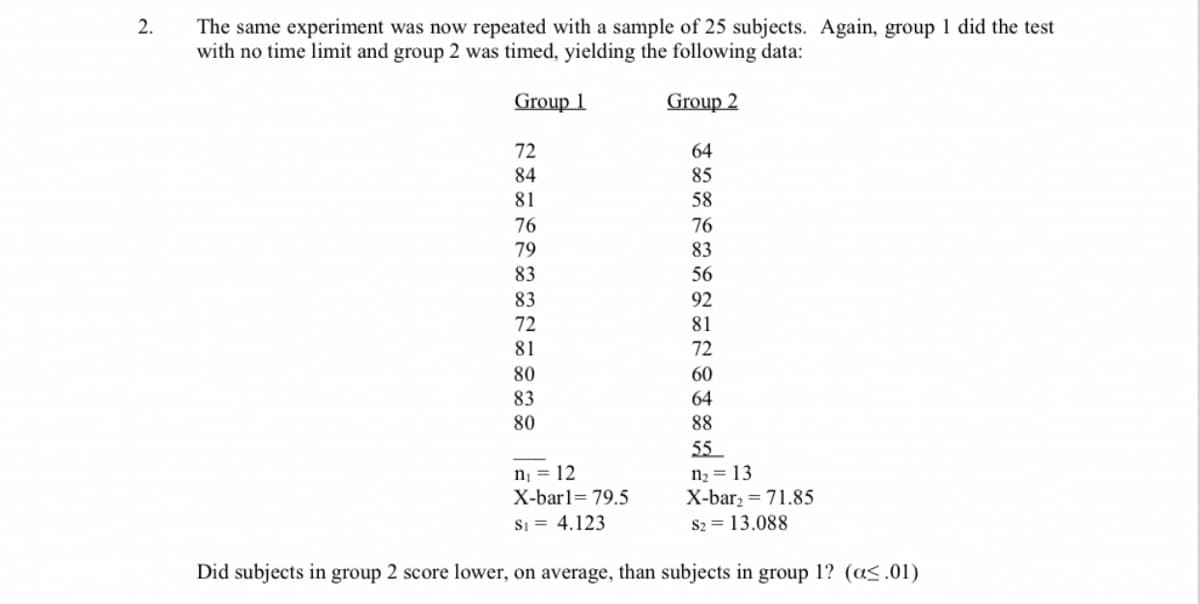
2. The same experiment was now repeated with a sample of 25 subjects. Again, group 1 did the test with no time limit and group 2 was timed, yielding the following data: Group 1 Group 2 72 84 81 76 79 83 83 72 81 64 85 80 83 80 58 76 83 56 92 81 72 60 64 88 55 n₁ = 12 n₂ = 13 X-bar1= 79.5 Si= 4.123 X-bar₂ = 71.85 $2= 13.088 Did subjects in group 2 score lower, on average, than subjects in group 1? (a<.01)
2. The same experiment was now repeated with a sample of 25 subjects. Again, group 1 did the test with no time limit and group 2 was timed, yielding the following data: Group 1 Group 2 72 84 81 76 79 83 83 72 81 64 85 80 83 80 58 76 83 56 92 81 72 60 64 88 55 n₁ = 12 n₂ = 13 X-bar1= 79.5 Si= 4.123 X-bar₂ = 71.85 $2= 13.088 Did subjects in group 2 score lower, on average, than subjects in group 1? (a<.01)

Glencoe Algebra 1, Student Edition, 9780079039897, 0079039898, 2018
18th Edition
ISBN:9780079039897
Author:Carter
Publisher:Carter
Chapter10: Statistics
Section10.1: Measures Of Center
Problem 9PPS

Related questions
Question
Plz answer both questions
Answers:
2. Fobt= 10.08, reject H0, do Wilcoxon; Zobt = 1.197, do not reject Ho
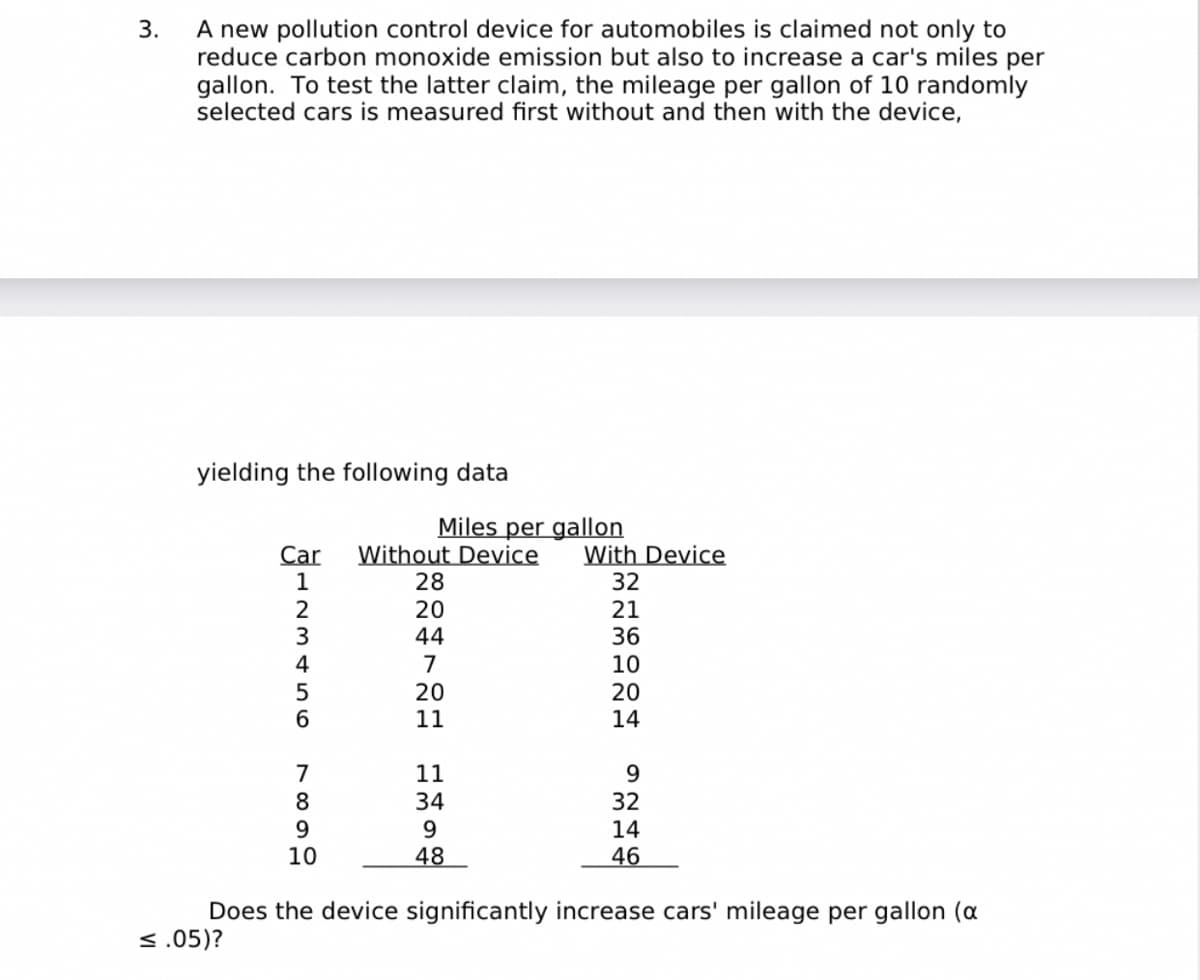
3. t =0.163, Do not reject Ho; no evidence that the device increases cars' mpg
Transcribed Image Text:2.
The same experiment was now repeated with a sample of 25 subjects. Again, group 1 did the test
with no time limit and group 2 was timed, yielding the following data:
Group 1
Group 2
72
84
81
64
85
58
76
83
56
92
81
72
60
64
88
55
n₁ = 12
n₂ = 13
X-bar1= 79.5
Si= 4.123
X-bar₂ = 71.85
$2= 13.088
Did subjects in group 2 score lower, on average, than subjects in group 1? (a<.01)
76
79
83
83
72
81
80
83
80
Transcribed Image Text:3.
A new pollution control device for automobiles is claimed not only to
reduce carbon monoxide emission but also to increase a car's miles per
gallon. To test the latter claim, the mileage per gallon of 10 randomly
selected cars is measured first without and then with the device,
yielding the following data
Car
L23456
1
7899
10
Miles per gallon
Without Device With Device
32
21
36
10
20
14
28
20
44
7
20
11
11
34
9
48
9
32
14
46
Does the device significantly increase cars' mileage per gallon (a
<.05)?
Expert Solution
This question has been solved!
Explore an expertly crafted, step-by-step solution for a thorough understanding of key concepts.

Step by step
Solved in 6 steps with 18 images

Recommended textbooks for you
Glencoe Algebra 1, Student Edition, 9780079039897…
Algebra
ISBN:
9780079039897
Author:
Carter
Publisher:
McGraw Hill
Glencoe Algebra 1, Student Edition, 9780079039897…
Algebra
ISBN:
9780079039897
Author:
Carter
Publisher:
McGraw Hill