2. The theory of liquidity preference and the downward-slopingaggregate demand curve Suppose the money market for some hypothetical economy is given by the following graph, which plots the money demand and money supply curves. Assume the central bank in this economy (the Fed) fixes the quantity of money supplied. Suppose the price level increases from 90 to 105. Shift the appropriate curve on the graph to show the impact of an increase in the overall price level on the market for money. ? INTEREST RATE (Percent) 18 15 12 D 10 3 O 0 20 40 Money Supply Money Demand 60 80 MONEY (Billions of dollars) 100 120 Money Demand Money Supply Following the price level increase, the quantity of money demanded at the initial interest rate of 9% will be supplied by the Fed at this interest rate. As a result, individuals will attempt to bonds and other interest-bearing assets, and bond issuers will realize that they restored in the money market at an interest rate of than the quantity of money their money holdings. In order to do so, they will interest rates until equilibrium is
2. The theory of liquidity preference and the downward-slopingaggregate demand curve Suppose the money market for some hypothetical economy is given by the following graph, which plots the money demand and money supply curves. Assume the central bank in this economy (the Fed) fixes the quantity of money supplied. Suppose the price level increases from 90 to 105. Shift the appropriate curve on the graph to show the impact of an increase in the overall price level on the market for money. ? INTEREST RATE (Percent) 18 15 12 D 10 3 O 0 20 40 Money Supply Money Demand 60 80 MONEY (Billions of dollars) 100 120 Money Demand Money Supply Following the price level increase, the quantity of money demanded at the initial interest rate of 9% will be supplied by the Fed at this interest rate. As a result, individuals will attempt to bonds and other interest-bearing assets, and bond issuers will realize that they restored in the money market at an interest rate of than the quantity of money their money holdings. In order to do so, they will interest rates until equilibrium is

Principles of Economics (MindTap Course List)
8th Edition
ISBN:9781305585126
Author:N. Gregory Mankiw
Publisher:N. Gregory Mankiw
Chapter34: The Influence Of Monetary And Fiscal Policy On Aggregate Demand
Section: Chapter Questions
Problem 6PA

Related questions
Question
Transcribed Image Text:2. The theory of liquidity preference and the downward-slopingaggregate demand curve
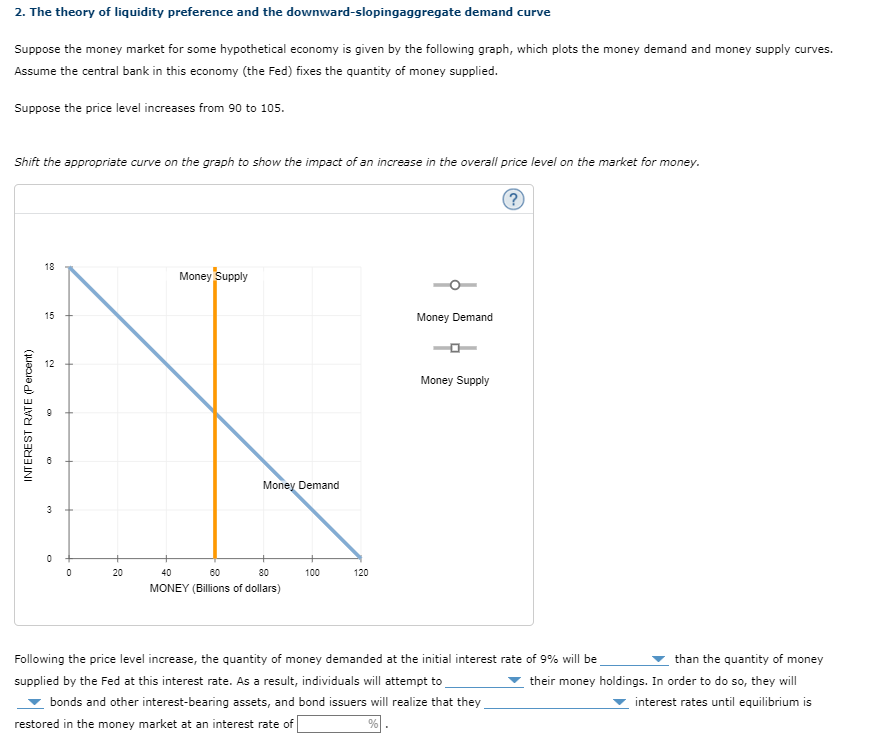
Suppose the money market for some hypothetical economy is given by the following graph, which plots the money demand and money supply curves.
Assume the central bank in this economy (the Fed) fixes the quantity of money supplied.
Suppose the price level increases from 90 to 105.
Shift the appropriate curve on the graph to show the impact of an increase in the overall price level on the market for money.
INTEREST RATE (Percent)
18
15
12
8
3
0
0
20
Money Supply
Money Demand
40
60
80
MONEY (Billions of dollars)
100
120
Money Demand
Money Supply
Following the price level increase, the quantity of money demanded at the initial interest rate of 9% will be
supplied by the Fed at this interest rate. As a result, individuals will attempt to
bonds and other interest-bearing assets, and bond issuers will realize that they
restored in the money market at an interest rate of
%
than the quantity of money
their money holdings. In order to do so, they will
interest rates until equilibrium is
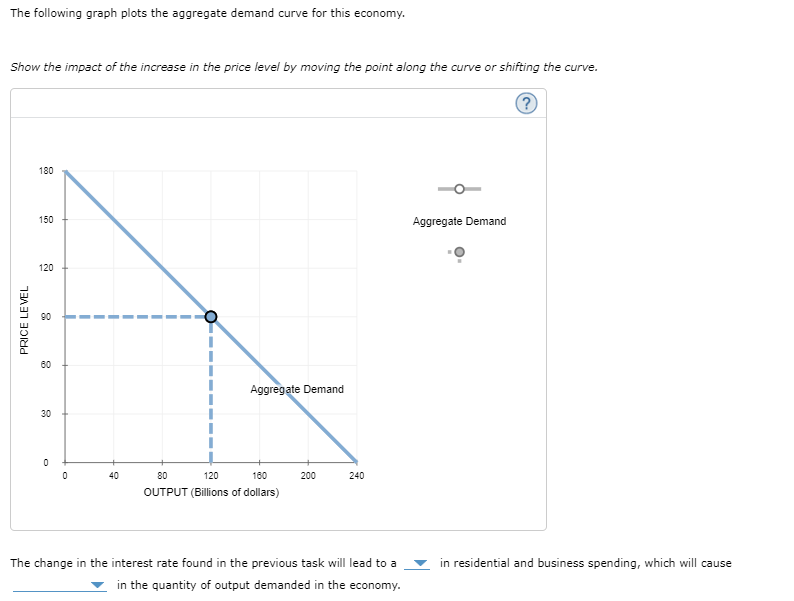
Transcribed Image Text:The following graph plots the aggregate demand curve for this economy.
Show the impact of the increase in the price level by moving the point along the curve or shifting the curve.
PRICE LEVEL
180
150
120
90
60
8
30
0
0
I
40
Aggregate Demand
80
120
160
OUTPUT (Billions of dollars)
200
240
The change in the interest rate found in the previous task will lead to a
in the quantity of output demanded in the economy.
Aggregate Demand
in residential and business spending, which will cause
Expert Solution
This question has been solved!
Explore an expertly crafted, step-by-step solution for a thorough understanding of key concepts.

This is a popular solution!

Trending now
This is a popular solution!

Step by step
Solved in 4 steps with 2 images

Knowledge Booster


Learn more about
Need a deep-dive on the concept behind this application? Look no further. Learn more about this topic, economics and related others by exploring similar questions and additional content below.Recommended textbooks for you
Principles of Economics (MindTap Course List)
Economics
ISBN:
9781305585126
Author:
N. Gregory Mankiw
Publisher:
Cengage Learning

Brief Principles of Macroeconomics (MindTap Cours…
Economics
ISBN:
9781337091985
Author:
N. Gregory Mankiw
Publisher:
Cengage Learning

Principles of Macroeconomics (MindTap Course List)
Economics
ISBN:
9781285165912
Author:
N. Gregory Mankiw
Publisher:
Cengage Learning
Principles of Economics (MindTap Course List)
Economics
ISBN:
9781305585126
Author:
N. Gregory Mankiw
Publisher:
Cengage Learning
Brief Principles of Macroeconomics (MindTap Cours…
Economics
ISBN:
9781337091985
Author:
N. Gregory Mankiw
Publisher:
Cengage Learning
Principles of Macroeconomics (MindTap Course List)
Economics
ISBN:
9781285165912
Author:
N. Gregory Mankiw
Publisher:
Cengage Learning

Principles of Economics, 7th Edition (MindTap Cou…
Economics
ISBN:
9781285165875
Author:
N. Gregory Mankiw
Publisher:
Cengage Learning

Principles of Macroeconomics (MindTap Course List)
Economics
ISBN:
9781305971509
Author:
N. Gregory Mankiw
Publisher:
Cengage Learning

Essentials of Economics (MindTap Course List)
Economics
ISBN:
9781337091992
Author:
N. Gregory Mankiw
Publisher:
Cengage Learning