2. The United States Census uses world population information to model population growth. The table and graph below show information for one linear model that the Census Bureau created. World population growth 10.00 9.00 8.00 700 6.00 500 4.00 3.00 2.00 1.00 000 10 20 30 40 50 60 70 80 90 Years since 1960 3. Years Since 1960 10 20 30 40 50 60 70 80 Worlds Population (in billions) 3.75 4.50 5.25 6.00 6.75 7.50 8.25 9.0 (a) Does the graph show information about a vertical intercept? (b) Pick two ordered pairs corresponding to points on the graph. Use those ordered pairs to caleulate rate of change. Make sure you write the correct units in your answer. (c) Compare the rate of change you calculated with the aAnswers other people found. Are all of the rates of change the same? If so, why? Estimated worid pepubton in billons
2. The United States Census uses world population information to model population growth. The table and graph below show information for one linear model that the Census Bureau created. World population growth 10.00 9.00 8.00 700 6.00 500 4.00 3.00 2.00 1.00 000 10 20 30 40 50 60 70 80 90 Years since 1960 3. Years Since 1960 10 20 30 40 50 60 70 80 Worlds Population (in billions) 3.75 4.50 5.25 6.00 6.75 7.50 8.25 9.0 (a) Does the graph show information about a vertical intercept? (b) Pick two ordered pairs corresponding to points on the graph. Use those ordered pairs to caleulate rate of change. Make sure you write the correct units in your answer. (c) Compare the rate of change you calculated with the aAnswers other people found. Are all of the rates of change the same? If so, why? Estimated worid pepubton in billons

Algebra & Trigonometry with Analytic Geometry
13th Edition
ISBN:9781133382119
Author:Swokowski
Publisher:Swokowski
Chapter5: Inverse, Exponential, And Logarithmic Functions
Section5.3: The Natural Exponential Function
Problem 42E

Related questions
Question
100%
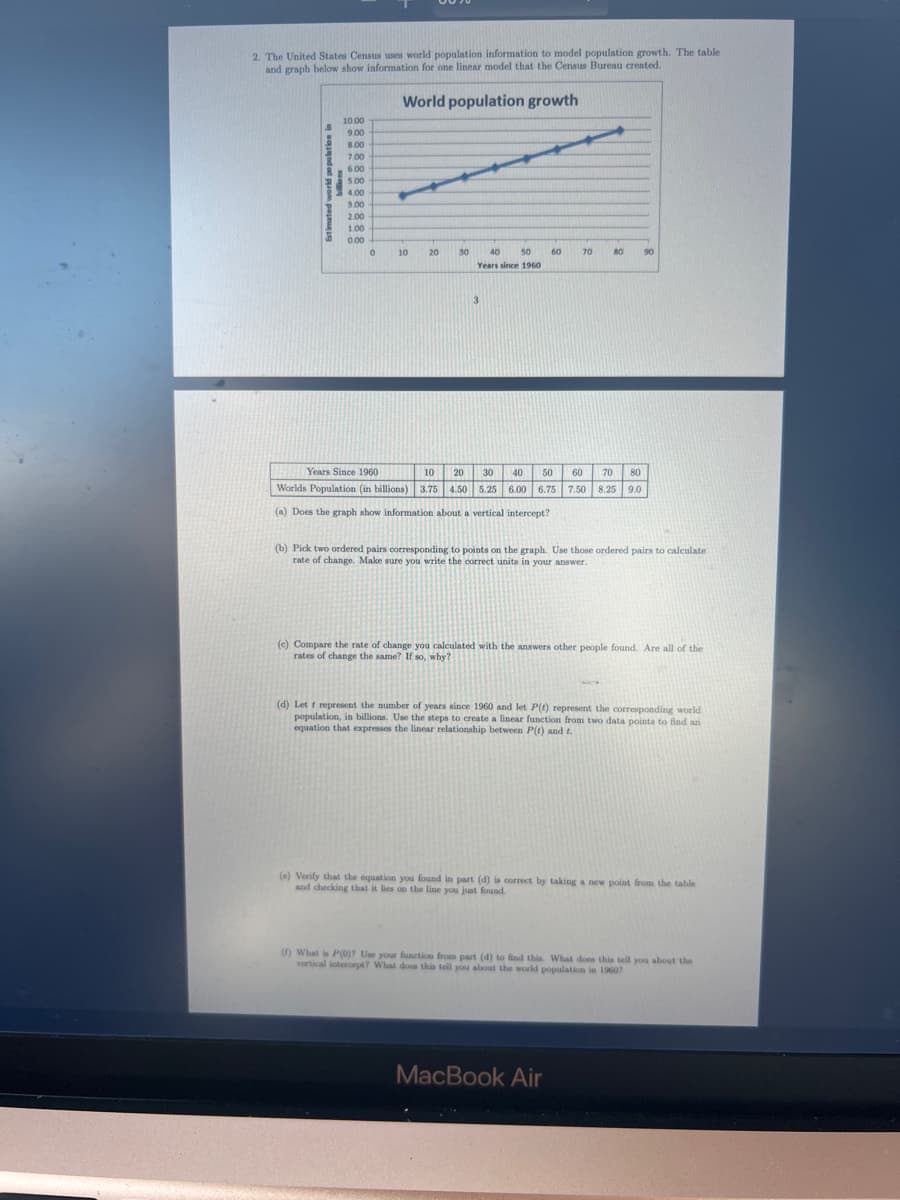
Transcribed Image Text:2. The United States Census uses world population information to model population growth. The table
and graph below show information for one linear model that the Census Bureau created.
World population growth
10.00
9.00
8.00
7.00
R6.00
500
4.00
3.00
2.00
1.00
0.00
10
20
30
40
50
60
70
80
90
Years since 1960
3
Years Since 1960
10
20
30
40
50
60
70
80
Worlds Population (in billions) 3.75 4.50
5.25 6.00
6.75 7.50 8.25 9.0
(a) Does the graph show information about a vertical intercept?
(b) Pick two ordered pairs corresponding to points on the graph. Use those ordered pairs to caleulate
rate of change. Make sure you write the correct units in your answer.
(c) Compare the rate of change you calculated with the answers other people found. Are all of the
rates of change the same? If so, why?
(d) Let t represent the number of years since 1960 and let P(e) represent the corresponding world
population, in billions. Use the steps to create a linear function from two data points to find an
equation that expresses the linear relationship between P(t) and t.
(e) Verify that the equation you found in part (d) is correct by taking a new point from the table
and checking that it lies on the line you just found.
() What is P(0)? Use your function from part (d) to find this. What does this tell you about the
vertical intercept? What dos this tell you about the world population in 19607
MacBook Air
Expert Solution
This question has been solved!
Explore an expertly crafted, step-by-step solution for a thorough understanding of key concepts.

This is a popular solution!

Trending now
This is a popular solution!

Step by step
Solved in 2 steps with 3 images

Recommended textbooks for you
Algebra & Trigonometry with Analytic Geometry
Algebra
ISBN:
9781133382119
Author:
Swokowski
Publisher:
Cengage
Algebra & Trigonometry with Analytic Geometry
Algebra
ISBN:
9781133382119
Author:
Swokowski
Publisher:
Cengage